Author Archives: Infinite Ideas
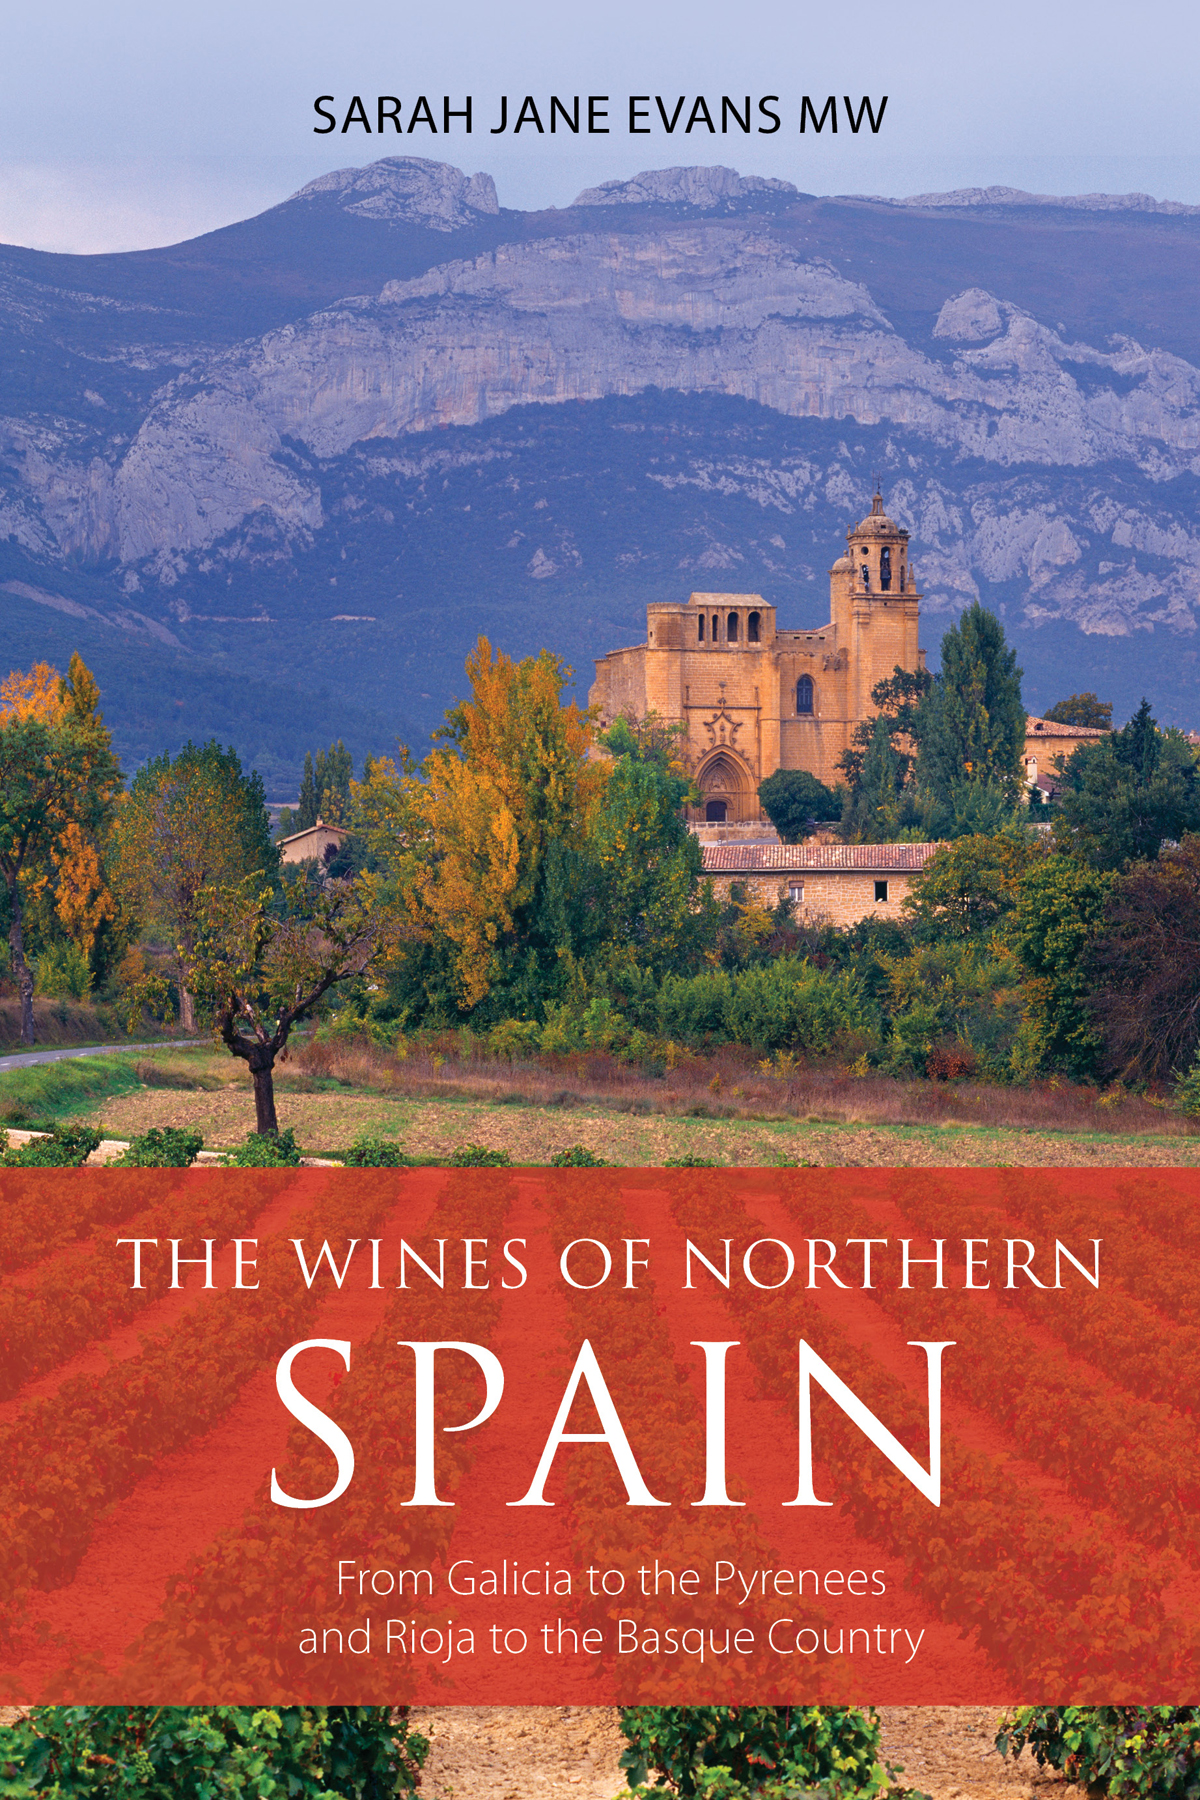
Extract: The wines of northern Spain by Sarah Jane Evans MW
16 May 2022 by Infinite Ideas in Classic Wine Library, Extracts, Wine and spirits
Rioja: a world within a world
What’s the best way to arrive in Rioja? For me, it’s coming from Bilbao, taking the road through the mountains and watching Rioja as it unfolds before you. The mountains are majestic, and in between is undulating countryside with rivers running through and hilltop towns spread about. There’s a lot to be said for arriving by rail, too. Take the train from Zaragoza. The last section, Logroño–Haro, meanders past the Ebro and vineyards. For the people who lived here in previous centuries Rioja must have seemed a blessed enclave. Any time is good to come: autumn is particularly beautiful; winter brings snow (and sometimes problems driving); in spring there’s blossom on the trees and in the summer it’s hot, but with plenty of cool places to enjoy wine in the evening. Too many wine regions can be flat monocultures of vines. Come to Rioja, it’s altogether more human.
Haro and the station quarter
When phylloxera came to France, the producers cast around for vine-growing land. Spain was conveniently close and with the opening of the railway line from Logroño to Bilbao via Haro in 1880, Rioja was an ideal source. Thus it was that Haro’s Barrio de la Estación came into being, with wineries clustered around the railway. The first to arrive was R. López de Heredía y Landeta in 1877, followed by CVNE in 1879, Duque de Montezuma and J. Gómez Cruzado in 1890, La Rioja Alta in 1890 and Bodegas Bilbaínas in 1901. (To complete the contemporary set, Muga moved from Haro town in 1970, and in 1987 came RODA.) In those early years the bodegas jostled with factories making brandies, soaps and fertilizers. While some of the Haro bodegas may seem today the epitome of classical wines, Haro was cutting-edge in its day – the first town in Spain to have electric street lighting.
Phylloxera came to Rioja, inevitably, in 1899. The first outbreak was in a vineyard in Sajazarra. The region recovered reasonably quickly as by then the wine world had discovered that the solution was to graft vines onto much more resistant American labrusca rootstocks.
For a number of years Rioja continued to define itself like so many parts of the world in terms of French wines, for instance by selling ‘cepa Borgoña’ (intended to mean ‘Burgundy style’) wines. The really significant change, after Spain’s entrance to Europe, was Rioja’s elevation to DOCa status, denominación de origen calificada, a first in Spain in 1991. While regulation can be criticized for too much policing and of the wrong kind, it has to be noted that a DOCa should never be about selling any wine at bargain basement prices. The very nature of being a DOCa should protect it from that unsustainable marketing. Yet when the DOCa was introduced it was a generic blanket for all Rioja wines to satisfy all interested parties: grower, small producer, cooperative and multinational. Hence Rioja can be sold too cheaply. Surely the wine world has changed? One size (or type of classification) need not fit all.
The naming of Rioja
Before we go any further, this is the place to run through the ever-growing list of possibilities behind the naming of the region. There is a River Oja, which surely must be the reason for Rioja’s name. But this is a little trickle compared to the grandeur of the Ebro, and its dominance in the landscape. Then there’s a possibility it refers to a local tribe called in Latin, Ruccones. Another source suggests that the source is Erriotxa or a similar spelling, which means ‘bread country’ in Basque. The US writer Ana Fabiano suggests that it might come from Rialia, describing a collection of small tributaries in Rioja Alta around the River Oja. She also speculates that it could come from the Basque Arrioixa, or ‘land of rocks’. And thus, the debate continues.
Defining the landscape
Those who like to define Rioja in terms of Burgundy, will note that in geographical terms there are similarities. Imagine Rioja turned upright, clockwise through 45 degrees, and there you have Burgundy. It is approximately 40 kilometres wide by 100 kilometres long, running from north-east to south-west, tucked in between mountain ranges. Administratively it is composed of three provinces: La Rioja (43,885 hectares of vineyards, 118 municipalities), Álava, the southern tip of the Basque country (12,934 hectares, 18 municipalities), and to the east, Navarra (6,774 hectares, 8 municipalities). There is also one bodega to the far west of Rioja that is in Castilla y León. Climatically there are strong differences. Nothing is straightforward about the soils, either, a complex blend of chalky clay, ferrous clay and alluvial types. Add to this the differing aspects and elevations – up to 700 metres, and in a few cases up to 900 metres. Blend in the grape varieties. To finish, there are the decisions of the producers, each serving diverse customer tastes.
The River Ebro, which decants to the Mediterranean, winds through Rioja and into it flow seven significant small rivers – significant in terroir terms, that is, each offering different aspects and soils. All of these come down from the Iberian system of mountains to the south. Starting in the west, the River Oja rises to the south of Rioja in the San Lorenzo mountains and flows down to Haro. The snows and cold of the Sierra Demanda above the river valley have a strong influence on the higher altitude vineyards. Next comes the Najerilla river valley. Again, it rises in the San Lorenzo mountains and comes down to the Ebro with many terraces of vineyards on both sides. The Iregua valley to the east of it flows down to Logroño, creating fertile conditions for plenty of market garden produce and olives. The River Leza joins the Jubera before arriving at Agoncillo by the Ebro, and is distinctive for its cliffs and canyons. Great for walkers, both rivers are distinctive for the difference from the elegant beauty of some of the Rioja Alta landscapes. Finally, the Cidacos valley winds at length down past the Monte Yerga, and the high Garnacha-dominant vineyards of Quel and Arnedo till it comes to the Ebro just after Calahorra.
Rioja’s story is all about diversity. As Ana Fabiano notes, Rioja contains 36 per cent of all the plant biodiversity in Spain. Furthermore when vineyard sites range from 300 to 700 metres, the climate really varies, and that’s before one takes in considerations of slope, aspect and soil. That’s why the vintage assessments beloved of fine wine retailers and auction houses are so difficult. Take the terrible frosts of April 2017. They wiped out 100 per cent of some vineyards, but others escaped completely. In terms of climatic influences, at the north-west end, Rioja is little more than 100 kilometres from the Atlantic, which gives the producers of Rioja Alta a good reason to describe their cooler vintages as Atlantic. The Sierra Cantabria is some protection from the Atlantic extremes. To the south the frequently snow-capped Sierra de la Demanda and the Sierra de Cameros protect the valleys of Rioja from strong winds from the south-west.
To blend or not to blend?
There are now so many styles of Rioja – modern, vino de autor, single vineyard, carbonic maceration and more – and so many strongly held opinions that it is easy to lose sight of one important quality in many fine Riojas. Namely, that they are blends. There are historical reasons for this. Many producers did not own their own vineyards, and there are commercial brands which still don’t. They rely on the growers for supply, growers from right across Rioja. Then there are also producers who wanted to make classical blends of two or more varieties, of Tempranillo with Graciano or Mazuelo, for instance, who own vineyards or buy their grapes from the best places, but not necessarily close to the winery. Rioja Alta producers sourced and still source their Garnacha grapes from Tudelilla in Rioja Baja. This was never an issue, until the debate promoting single vineyard wines became so excessively heated.
There are many kinds of Rioja. Which is better: a cross-DOCa blend of the best grapes, or a single vineyard where perhaps only one variety flourishes? This is the same debate over the merits of Penfold’s Grange and Henschke’s Hill of Grace in Australia. One is a multi-regional blend, the other a historic single vineyard. Different styles, different consumers, equal pleasure. Everyone has different views: my current notebook is filled with diagrams of Burgundian-style pyramids (Bierzo proposals), interlocking circles (neighbouring village proposals) and criss-crossing rectangles (the CRDOCa vision). Speaking at RODA, director general and all-round viticultural expert Agustín Santolaya pleaded: ‘Don’t Burgundify Rioja’. RODA is the newbie in the Barrio de la Estación, having only been founded in 1989. Santolaya’s mission is to make the best wine from a blend of the best vineyards; the traditional approach, though perhaps in a modern way. Look back at history, he says: ‘Traditionally Rioja blended its wines from great vineyards; there were practically no single vineyard wines made.’
White Rioja reborn
A decade ago, perhaps less, white Rioja had a really terrible reputation. The general view was that it was made from only one variety – Viura – and that Viura was flabby and boring. Yet in just a few years white Rioja has returned to favour. It may still only account for some 6–7 per cent of Rioja production but from that low base its market share has been increasing by some 20 per cent year on year. There are a number of reasons for this. They include: climate change, improved distribution, the requirements of export markets and the creativity of individual winemakers, while maintaining respect for the old ways and the classics. The launch of the latest Castillo Ygay 1986 white from Marqués de Murrieta with some 30 years of age hit the fine wine headlines and helped to bolster the profile of white Rioja as something exceptional. Of course, like the Viña Tondonia Gran Reserva white, it is a one-off, an original. In general, today’s white Riojas are – many of them – beautifully balanced, with subtle oak, and complex. They could not be further from the oxidized, tired wines of the past.
White Rioja is not just made from Viura – though it remains the dominant variety. Malvasía de Rioja (know in Catalunya as Subirat Parent), with its distinctive reddish, yellowish bunches, plays a small but significant part. Garnacha Blanca again amounts for a tiny percentage of the vineyard, but is making some finely textured wines. The Consejo Regulador wobbled a little when it permitted the introduction of Chardonnay and Sauvignon Blanc to an already fine line-up of varieties. An understandable step, an attempt to give their wines an international appeal, but the future for a DOCa lies in making great terroir wines with local varieties.
New varieties are appearing. Tempranillo Blanco made the headlines first. This is a genetic mutation; a single plant with white grapes was found in 1988 in Rioja, in Murillo del Río Leza. It’s a late budding variety, but like the red Tempranillo it ripens early. It can show citrus and floral notes and has been popular because of its relationship to Tempranillo itself. Another of the ‘new’ varieties is in fact an old variety, rescued and revived. Maturana Blanca is the oldest known grape variety in Rioja, and may have been referred to in 1622. The fact that it is sensitive to botrytis will have helped it fall out of favour. In character it has bright acidity, a tendency to warm alcohol, and a hint of bitterness on the finish. Another ‘new’ variety is Turruntés de Rioja, no relative of the Galician Turruntés or the Argentine Torrontes. Instead it is similar to Albillo Mayor, found in Castilla y León. It is low in alcohol, with a welcome high acidity, offering crisp apple notes. For a taste of these traditional and new white varieties, look to Abel Mendoza, and to Juan Carlos Sancha, the university lecturer and bodeguero, who has also fostered these rarities.
Extract from The wines of northern Spain © Sarah Jane Evans (Infinite Ideas, 2018)
To read more, buy your copy direct from the Classic Wine Library shop.
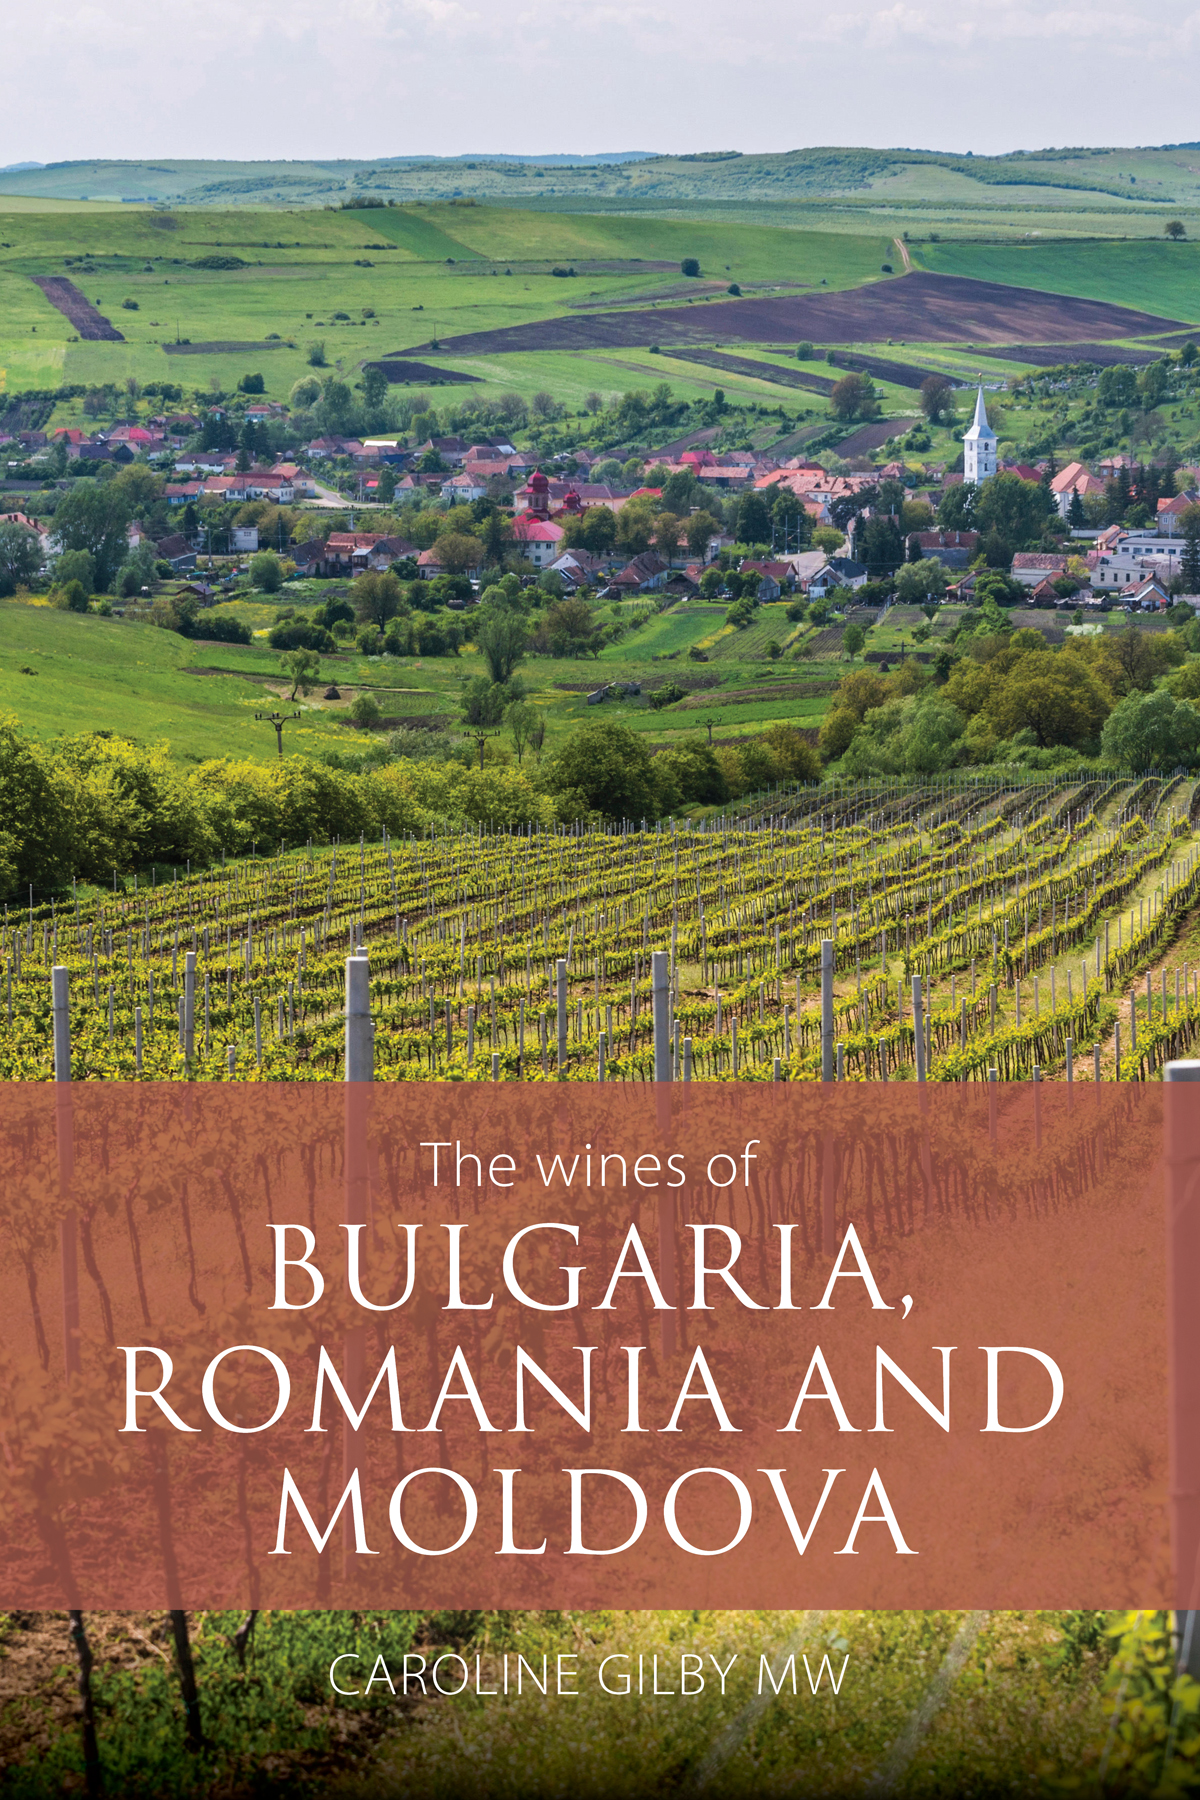
Extract: The wines of Bulgaria, Romania and Moldova, by Caroline Gilby MW
16 May 2022 by Infinite Ideas in Classic Wine Library, Extracts, Wine and spirits
The wines of Bulgaria
Bulgaria is a wine country very close to my heart – exciting and frustrating in equal measure. It was only the second wine country I visited in my professional career, when Eastern Europe was my first buying responsibility as a trainee buyer back in the late 1980s. I’ve seen this country take its first steps into a new era, just as I did myself. And I like to think that we’ve matured together, though the relationship has had its rocky moments.
That first trip to Bulgaria was eye-opening, not least because my one and only previous trip had been to Château Lascombes in Margaux. Memories have stuck fast of grim communist wineries; vast marching rows of vines supported by crumbling concrete; dining in huge, ornate ballrooms empty apart from our group; inevitable cucumber and tomato accompanied by ‘tractor fuel’ (a.k.a. rakia) at every meal and scrabbling for coins to pay for a few sheets of scratchy toilet paper from a babushka-type with bad hair-dye. I carried on buying Bulgarian wines when I was back in the UK but didn’t go back to the country for another dozen years or so.
In 2003 I returned for the first internationally judged wine competition, along with Jancis Robinson and a handful of judges from Norway, Poland and Scandinavia. So much was different; better hotels (with free toilet paper) and much better food (though cucumber and tomato are always standard fare). Usually everything was drowned in a thick fog of Balkan tobacco smoke. A mouthful of food and a puff on a cigarette wasn’t uncommon in those days (a habit that only faded with the indoor smoking ban in 2012). Winemaking was evolving, with the first few individual pioneers like Maxxima and Santa Sarah starting to appear, and privatization issues on their way to being resolved. But the larger wineries still seemed to believe that grapes grow in the back of trucks and couldn’t understand when we wanted to look at actual grapevines.
For some though, I think the proverbial penny (or stotinka) was beginning to drop as they realized that controlling fruit quality was going to be the next step for Bulgaria. Of course, problems of land ownership and vineyard neglect were still huge and have had major implications for Bulgaria.
Like all of Eastern Europe, Bulgarian wine has undergone a complete revolution from those early days of communist-scale, cheap, cheerful Bulgarian Cabernets; the ones I used to drink regularly as a student. I remember waiting with great anticipation for the arrival of Oriahovitza Reserve 1979 in Oddbins in the mid-1980s. There was nowhere else where you could get a wine with this level of maturity for the sort of price that even a student could afford. But the wine industry has undergone a complete revolution since then, through the challenges and problems of privatization, and has emerged as an exciting and dynamic scene, scattered with wines that I would be genuinely happy to recommend to anybody.
There is more to wine than just an enjoyable liquid (though obviously that’s important) and the stories behind the wine scene in Bulgaria are fascinating, though it hasn’t always been easy to get Bulgarians to genuinely open up and talk about it. And yet on the other hand Bulgarians are outspoken and blunt, and will tell you exactly what they think of you in so many words. Trust is a difficult thing for Bulgarians still, and they always seem to think there’s a catch, or a hidden agenda, so getting the wineries to tell me their genuinely personal stories has sometimes been hard. The more Latinized Romanians and even the Soviet-scarred Moldovans seem to have found it easier. And it’s a shame, because when you do get through that shell, Bulgarians and their wines are well worth getting to know.
Vineyards
The landscape of the Bulgarian wine industry has changed dramatically since the fall of the Iron Curtain and even more so since the completion of privatization. Accession to the EU in 2007 accelerated the pace of change, bringing with it reformed laws on winemaking as well as significant investment.
As part of the EU membership negotiations, Bulgaria agreed a vineyard area of 153,000 hectares, and official data for 2006 showed an area under vine of 135,760 hectares. However, this was never a realistic reflection of the area of viable productive vineyards and was most likely a political decision to give the industry maximum possible planting rights (which were extremely limited within the EU, basically requiring like for like replacement). Vineyard area continued to fall and the Ministry of Agriculture’s Annual Agrarian Report stated there were just 46,145 hectares in production in 2011, which fell further, to 36,551 hectares, by 2016.
Nearly half of Bulgaria’s vines are more than thirty years old, but in the last five years 6,000 to 8,000 hectares have been renovated each year. This almost certainly reflects purchase of land and planting or replanting of vineyards by large wineries, as well as the emergence of small and medium-sized new wineries with quality aspirations. Today, the majority of wineries have their own vineyards supplying all or part of their needs, and where they don’t own vines, longer term contracts specifying fruit quality and vine management are typically in place.
Vineyard development is likely to continue. Bulgaria had established a government-funded wine sector programme, worth nearly €70 million from 2014 to 2018, to support further conversion and restructuring of vineyards, plus investments in wine cellars and green measures. The change in attitude from technology towards the land shows the major mental switch that the industry has undergone. However, there is still a need to get to grips with the next step, which is to understand what the right locations for specific varieties are, and not just plant vines wherever a winery has been able to buy a plot of land. Look at France for examples of where the link from people to land has been uninterrupted for centuries (unlike Bulgaria where the link between land and individual people was largely destroyed over the years of communism). There are long established reasons why Pinot and Chardonnay grow in continental Burgundy while Cabernet and Sauvignon Blanc reign in the Atlantic climates of Bordeaux and the Loire, and Syrah and Viognier suit the baking heat of the Rhone. It’s worth noting how little varietal overlap there is too, unlike in Bulgaria where many of these grapes are found together in the same vineyard. The alternative way of looking at this is that Bulgaria is experimenting with freedom from prescriptive laws about what to plant where.
There are two aspects to quality: the first is freedom from faults and off flavours, while the second relates to the individuality and complexity derived from a location that imparts its unique character. Bulgaria needs to learn from the mistakes of her New World competitors. Frequently vines have been planted without considering the suitability of the variety for each site, with winemakers putting their faith in the power of technology and modern winemaking to overcome any disadvantages, such as the wrong soil or excess heat, and ending up with uniform and even boring wines. In the early years of the new era, it was such a challenge to put together enough land in Bulgaria for a commercial vineyard that owners may have rushed into planting without thinking through what grapes might work best. Terroir may determine character and complexity, but the human factor determines quality level.
New vineyards have their place, and young vines do get older and better balanced in time, which is starting to happen now in Bulgaria with the first wave of new era vines. The earliest investments from the early to mid-2000s are now getting over this problem, and the wines are better for it, showing ripeness at lower and better balanced alcohol levels. Just as an example Bessa Valley Reserva 2006 was 15.7% abv and the latest release is a more harmonious 14.3% abv. But the industry should not forget the old vines – especially gnarly, ancient things planted decades ago. Such vines are often naturally in balance with roots reaching deep into the soil, but importantly, they are not the modern clones that are increasingly widespread, which suggests they have survived because they suited Bulgaria’s conditions. I would love to see someone taking cuttings before this potential treasure trove disappears in a sea of French or Italian clones. And the myth that old vines are automatically better is often disproved by the reality here. Older vineyards from communist times were planted for quantity, on vigorous rootstocks and fertile soils. Just getting old will never completely solve that problem, and in many older vineyards there are missing and sick vines, as well as a few that are overcropping, so giving very inconsistent results.
To explore the idea of terroir a bit further, three factors need to come together. First is the place itself – the soil, climate, microclimate, aspect, rainfall, wind, sun, altitude and nearby water – and of course vine varieties that suit all these factors. Second is competent winemaking, which allows what the place gives to shine through. It mustn’t dominate, either with faults, or through being too technical and manipulative. Third and arguably most important is the human factor – the passion to aim for high quality and to experiment. And yes, this may mean winemakers being prepared to put their reputations on the line and admit they got it wrong sometimes (and I know this is not something that comes easy to proud Bulgarians). There also needs to be a dose of realism, as there must be a market place to sell these wines into. Recent years have seen several Bulgarian producers embracing ‘terroir’ in a move to be recognized for fine wines. As Yuson Jung points out in her 2014 paper: ‘Terroir is a compelling narrative to legitimize the premium quality of their wines and enter the ranks of fine wine in the global wine hierarchy,’ adding that, ‘wine is not simply an alcoholic drink but a cultural commodity and a symbol of identity’.
Local or international – does Bulgaria need a flagship variety?
For the international market, local grape varieties are a good way of gaining interest and starting conversations, though selling a grape no one has heard of from a country with little reputation for quality wine can be a big ask. If a grape only comes from Bulgaria, it is – by definition – a wine of its place, and such local varieties can also be used to add Bulgarian character to blends. In some cases, the fact is that local grape varieties have remained local because they only suit specific local conditions or because they are too ethnic or rustic to gain wider attention. Shiroka Melnishka Loza for instance, only really suits the Struma Valley and its wines can be challenging to drink without modern winemaking. Grapes like Pamid appear totally unsuitable for producing quality wine that will appeal to modern drinkers.
In other cases, with a more knowledgeable approach to viticulture and winemaking there could well be some gems to discover. At the moment, Mavrud seems to be leading the way as Bulgaria’s red flagship, and today it is the most widely planted of the quality native grapes. By no means does everyone agree that this is the only choice, with supporters for Rubin, Melnik 55 and even Gamza. However, as Radoslav Radev (head of NVWC) pointed out to me, the situation is the opposite in the domestic market, where young people often associate local grape varieties with what their parents and grandparents drank. International grapes are the ones with glamour for new drinkers rebelling against their parents.
Finding the balance point between these conflicting demands is a challenge. There is also a valid argument that showing the world what Bulgaria can do with well-known grape varieties helps buyers understand what quality the country can offer. Adriana Srebrinova (owner of Maxxima and Borovitza) explains, ‘I think we will have a better chance of showing the unique qualities of Bulgarian wines through the place where we grow our grapes, because wine lovers in the world know how a Cabernet Sauvignon from Napa or a Bordeaux tastes, it is easy for them to discern the difference in a Bulgarian Cabernet.’
Extract from The wines of Bulgaria, Romania and Moldova © Caroline Gilby (Infinite Ideas, 2018)
To read more, buy your copy direct from the Classic Wine Library shop.
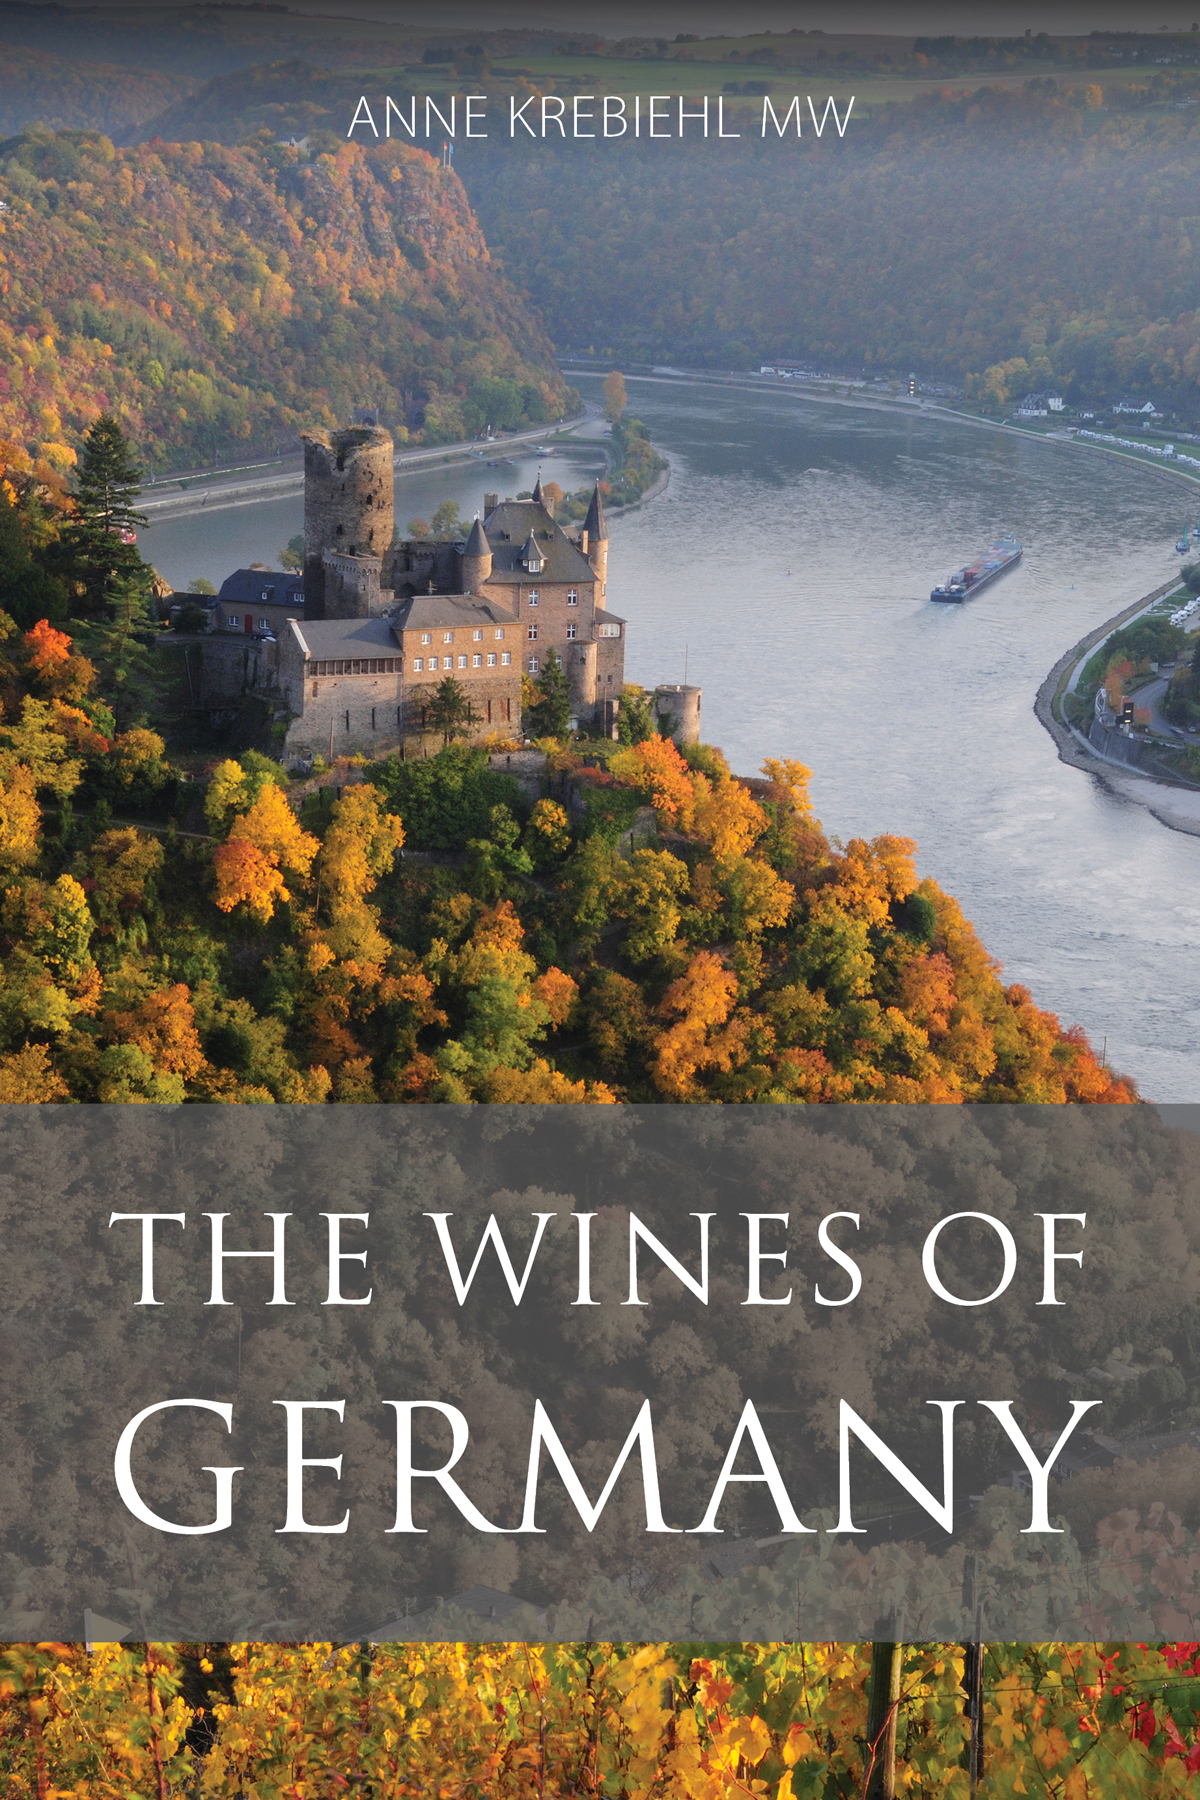
Extract: The wines of Germany, by Anne Krebiehl MW
16 May 2022 by Infinite Ideas in Classic Wine Library, Extracts, Wine and spirits
Mosel – a cosmos unto itself
Not only are the valleys of Mosel, Saar and Ruwer unique; they seem like a different universe. Here, grape, climate, soil and topography combine in such a fashion that the ancient contract between humans and vine, between sweat and fruit, is driven to its extreme. It is here that the greatest effort leads to the greatest lightness; that Riesling climaxes with absolute transparency, exactitude and expression. Nowhere else is it more apparent that it is light, not heat, that ripens grapes. Take the legendary south-facing Scharzhofberg in Wiltingen. You climb to its ridge and look at the shrub on its shaded, north-facing side: barely an apple would ripen there.
Until 2007 the Mosel region was still called ‘Mosel-Saar-Ruwer’, also crediting the valleys of the smaller tributaries. These subregions now go under the Mosel umbrella but are as distinct as ever. This region covers the final, brief stretches of three river valleys: the Mosel on its meandering path before it joins the Rhine at Koblenz, the Saar and Ruwer before they run into the Mosel at Konz and Trier, respectively. While the river Mosel rises in the French Vosges mountains and flows north past Metz and Schengen, the German wine region begins at the Luxembourg border. This is the relatively unknown Obermosel where Elbling and white Pinot varieties on Triassic formations dominate. What is commonly understood to be the Mosel region proper begins in Trier and follows the snaking river bends which take 237 kilometres to cover the 96 kilometre distance to Koblenz. By grinding its way into the 400-million-year-old sediments of the Rhenish Slate Massif between 15 and 2.5 million years ago, the river created this spectacular topography, curve by winding curve. The Mittelmosel, where all the most famous vineyards are, runs from Trier to Briedel. Its villages from south to north read like a wine menu: Leiwen, Piesport, Braunberg, Bernkastel, Graach, Wehlen, Traben-Trarbach and Enkirch. Driving along the Mosel in this narrow valley is confusing: the road follows the river but on alternating banks, so after one or two loops and bridges you lose all sense of direction. However, driving early in the morning allows you to see how the rising sun hits some knolls and slopes first, some dells and troughs later. At dusk some parcels are still sunlit while others have been shaded since noon. This mix of exposure, gradient, relative distance to the river and altitude already accounts for many differences in the wine. Add elements like varying subsoils, vine genetics, viticulture and winemaking and you have a perfect matrix of infinite possibility. This alone inspires awe, let alone the vertigo-inducing steepness of the rocky vineyards. The experience is much enhanced by the white lettering proclaiming the famous vineyard names from afar.
The stretch of river from Zell to Koblenz is called Terrassenmosel as the valley becomes a little warmer but much steeper, so vineyards are usually terraced. This is where Germany’s, and possibly Europe’s, steepest vineyard is, the Bremmer Calmont. The Mosel is of course synonymous with slate but there are variations of it as well as other formations. The fact that the Germans like to use the term Schiefer, or slate, freely causes much confusion so caution is advised. The oldest formations are Devonian shales, or Tonschiefer. Depending on colour they are named Blauschiefer or Grauschiefer and are the dominant formation in all three valleys. The same era also left some quartzite, especially in the Terrassenmosel as well as volcanic diabase in the Saar. The Permian era left rhyolite, red with iron oxide, which is often called Rotschiefer; the Ürziger Würzgarten is famous for it. All these formations are weathered to varying degrees; some are so fine you can crumble them in your hand. The dialect word ‘Lay’ means slate, explaining why this term crops up in so many vineyard names. In the Ruwer valley, just outside Trier, vines are more difficult to spot because the vineyards are choice, south-facing, singular slopes not on the Ruwer itself but on tiny tributaries, like Eitelsbach, Weschbach or Kundelbach. They are at slightly higher altitude and don’t benefit from the moderating effect of a sufficiently large body of water, so they are cooler than the Mosel valley. The same is true for the Saar, which is altogether more spacious, more remote and wilder. Merely its last 25 kilometres from just south of Serrig to its confluence with the Mosel at Konz constitute its world wine fame. Few vineyards are directly on the Saar and rise to 300 metres and beyond, both accounting for their coolness. These slopes are much more exposed to the elements. You realize how marginal the area is when you spot signs for the Viezstrasse, or cider route, which also is a speciality here. Saar vineyards are monumental in a different way from those in the Mosel. The good distances between them, their relative isolation and altitude seem to afford them lofty majesty and grandeur that underscores their individuality. The mere mention of sites like Kanzemer Altenberg, Ockfener Bockstein, Saarbuger Rausch, Ayler Kupp and Scharzhofberg will send shivers of pleasure down the spines of Riesling lovers.
But history also plays its part. Neither poetry nor artefacts leave any doubt that viticulture has been a central part of Mosel life since at least Roman times. The Mosel’s ‘rising, natural theatre of vines’ was described as early as the fourth century by Roman poet Ausonius, who had been summoned to Trier, or Augusta Treverorum, an important Roman settlement and garrison, to teach the sons of Emperor Valentinian. Remnants of Roman wine presses in Piesport and Brauneberg bear witness to active, early wine culture. After the invasion of the Franks, Trier emerged as an early centre of Christianity whose archbishops united worldly and ecclesiastic powers, expanded their territory and rose to become powerful electors in the twelfth century. The electorate of Kurtrier was an important church state and wine was central to its economy as countless records document: vineyards are named, Fuders bought and sold, trade regulated, and prices listed. In the tumultuous centuries surrounding the Thirty Years’ War, conflict was never far away, but viticulture, then still dominated by Elbling and field blends, always revived. In 1787 Elector Clemens Wenceslaus decreed that within the coming seven years all lesser varieties were to be grubbed up and replaced with quality vines like Riesling. Much is made of this famous edict but as later records show, it was never fully put into practice, especially since the French occupation of the left bank of the Rhine disrupted the political order once and for all. As one writer noted, the entire Mosel, ‘from its source to its confluence with the Rhine, became a French river.’ The area of Mosel, Ruwer and Saar which Napoleon’s troops had occupied since 1794 became the French Département de la Sarre in 1797. Secularization followed, as did the Code Civil, and former church possessions were sold off. Estates like Scharzhofberg and Maximin Grünhaus can trace their history to these transactions. It is believed that almost half of all vineyards changed hands at that time, a cataclysmic upheaval after centuries of feudalism.
By 1815 however, with Napoleon defeated, the area fell to Prussia. An initial period of prosperity was swiftly followed by disaster: the scrapping of protective tariffs combined with poor harvests spelled hunger and misery. The poverty he encountered among Mosel Winzer moved a young Karl Marx to pen several articles railing against Prussian injustice. Around the same time another social reformer, Ludwig Gall, introduced the idea of Nassverbesserung, literally ‘wet improvement’. Based on the ideas of Jean Antoine Chaptal in France, who had introduced ‘Chaptalization’, i.e. the enrichment of musts with sugar, Gall’s idea was the improvement of musts with sugar solution (sugar dissolved in water) which killed two birds with one stone: it enriched must and diluted acidity. Nassverbesserung thus made unpalatable, sour wine at least drinkable and therefore marketable. Needless to say, the method was and remained controversial, but became so widespread that gallisieren entered the vocabulary – no doubt the practice also helped to entrench the naturrein principle of unadulterated wine firmly in the German wine psyche. Yet this western backwater of Prussia remained desperately poor. Landowners with other income streams could survive, but for farmers especially reliant on viticulture in this narrow valley without much space for other arable crops, each vintage spelled either feast or famine. The Mosel flooded at regular intervals, too, creating more misery. If you look carefully you can see the high-water marks of past floods on doorways and bridges. Thorough as ever, the Prussians commissioned their cadastral inspector and tax councillor Franz Josef Clotten to create a vineyard site classification. Based on the site evaluations of Mosel, Saar and Ruwer vineyards conducted by the Prussian tax authorities between 1816 and 1832, this map was published in 1868 and graded vineyards into three classes. The best vineyards – mostly the same as today – were marked out in dark red and not only served tax purposes but also became a handy guide for wine merchants. A string of good vintages in the 1860s meant that Mosel wines were going up in the world. Geopolitically, Europe was changing, too. Prussia was in the ascendant, threatening the carefully calibrated European power balance of the Vienna Congress. France declared war in July 1870 and by February 1871 the Prussians were victorious. While the Franco–Prussian War set the scene for the creation of the Deutsches Reich in 1871, it also emphasized the strategic importance of the Mosel region. This formerly French and remote province now received a railway line that connected Berlin, Koblenz, Trier and Metz in the newly annexed region of Lothringen/Lorraine. Steamships had already eased transport, but the Mosel then was not navigable year round. Trains meant that wines could now go to market easily. Indeed, if you look closely at old Mosel labels you will see an unusual number of steamboats or locomotives signalling ready transport links. By the 1870s Mosel wines started to become highly fashionable. The English writer Henry Vizetelly described them in 1875 as lacking ‘the robustness of their brethren of the Rhine’ but noted that they were ‘at any rate light and delicate, and possessed of a fresh and at times even a decided flavour, rendering them highly palatable.’ While Rhine wines were drunk with bottle age, Mosel wines were drunk young. The wine chapter in the official catalogue of the Deutsches Reich for the 1900 World Exhibition in Paris gives a nod to this fashion by describing Mosel and Saar wines as ‘by now popular’. It was their marked difference to the revered, mature Rhine wines that set them apart. Conscious of the need to support the populace of a border region, in 1896 the government in Berlin started founding not one but three Staatsdomänen, or state domaines, in Avelsbach, Serrig and Wiltingen: this way the state could benefit from the profitable wine business while also providing research and teaching centres serving as model domaines for best practice.
It was also in the nineteenth century that Riesling’s predominance was cemented in the Mosel. In 1845, Servatius Muhl reports lots of field blends in Saar and Mosel, noting Kleinberger, i.e. Elbling, and a hotch-potch of varieties. He notes that Elbling is often co-planted with Riesling, quoting the local wisdom: ‘Kleinberger brings much wine, Riesling makes it good.’ He also remarks that Riesling is planted in some places where it will not ripen in weak and average years. Fifty-three years later in 1898, Koch and Stephanus note that as a development of the past 20 years Riesling had become the predominant variety – but they also point out that in lesser sites Riesling is mixed with Silvaner, Pinot varieties and Traminer. Occasionally there are references to red wine – made from Spätburgunder and Portugieser. They also emphasize the viticultural progress. It was at that time that several harvest passes were made in the best Riesling vineyards, and grapes of the same ripeness were fermented to create different wine styles. Mosel wine was thus at its zenith at the turn of the century – and would remain so until the First World War. In this golden age these wines were amongst the most expensive and desirable in the world. The decades that followed the war were marked by difficulty. The tough conditions of the Versailles Treaty, the economic crisis and inflation of 1929, the ascent of Nazi Germany that ended in devastation, loss and misery. Yet, when German chancellor Konrad Adenauer negotiated the release of the last German prisoners of war still captive in the Soviet Union with Nikita Khrushchev in 1955, he took precious Berncasteler Doctor Riesling from the 1950 vintage with him.
Recovery was slow in the immediate post-war years, but vineyard expansion was rampant from the 1960s to the 1980s. The fact that Nassverbesserung, that relic of the nineteenth century, was still allowed, coupled with the 1971 invention of Grosslagen, or collective sites, meant that much Mosel wine became a parody of itself. One of the most grotesque examples of a Grosslage is the Piesporter Michelsberg, or PiMi in bulk wine circles, with 1,106 hectares – larger than some German wine regions! The figures tell the story: in 1879 there were 6,144 hectares in the Mosel, of which 42 per cent were Riesling; by 1906 there were 7,484 hectares of which 88 per cent were Riesling. In 1964 there were 9,835 hectares of which 79 per cent were Riesling; in 1979 there were 12,298 hectares, of which 58 per cent were Riesling and 22 per cent Müller-Thurgau. All this rode on the coat-tails of former glory and culminated in the 1980s when several scandals broke: amongst them that of inverted sugar syrup in 1980, which centred on the Mosel, where sugar was used to create fake Prädikat-level wines from poor wines, and the diethylene glycol scandal of 1985, where this substance was added to wines to mimic the viscous mouthfeel of rich, sweet wine. Domestic and export markets collapsed and even blameless estates suffered. The region’s reputation lay in tatters. Various parcels on the steep slopes fell fallow.
It took the Mosel until the turn of the millennium to start recovering. Climate change has helped: ‘Mosel, Saar and Ruwer have benefited because there are no more sour wines. Viticulture is much better today. We want to maintain the delicacy, the positive lightness. Vineyards which used to be abandoned because they were too cool are being recultivated, we go higher up, we go into the lateral valleys,’ explains Johannes Selbach of Selbach-Oster. And now Spätburgunder is also winning plaudits. The past twenty years have seen a flowering of quality where old vineyards and vines are valued; where young winemakers invest their futures in this region; where visionaries like Ernie Loosen, Markus Molitor and Roman Niewodniczanski of van Volxem created a dynamo effect with their respective investments and achievements; where arch traditionalists like Egon Müller, Maximin Grünhaus and Joh. Jos. Prüm hold fast to their historic values. Once again Germany and the world are conscious of the uniqueness of Riesling that can be achieved here. The slopes are still as steep, but the counsel from an old book, ‘that no bread in Germany is earned harder, nor sliced more frugally, than in the Mosel,’ is thankfully consigned to history – even though the wines are far too cheap across the board for the effort that goes into growing them. It is a delicious contradiction that such monumental effort should lead to such weightlessness and delicacy. Today the stylistic spectrum of Riesling in this region alone is mind-blowing. If you wonder about the differences between Mosel and Saar Riesling, here are the opinions of two experts. Nik Weis of St Urbanshof says that ‘the particular conditions of the Mosel are even more heightened in the Saar,’ while Hanno Zilliken of Forstmeister Geltz Zilliken notes: ‘The difference between Mosel and Saar is the different weighting of constituents. A Mosel Riesling is carried by its fruit accompanied by acidity. A Saar Riesling is carried by its acidic structure accompanied by fruit.’ Fans should not miss two annual events: Mythos Mosel and Saar Riesling Sommer which draw an enthusiastic and young crowd.
Extract from The wines of Germany © Anne Krebiehl (Infinite Ideas, 2019)
To read more, buy your copy direct from the Classic Wine Library shop.
Top 10 management models for your business #6: Social media ROI pyramid
13 August 2014 by Infinite Ideas in 100+ Management Models, Business and finance
Fons Trompenaars and Piet Hein Coebergh, co-authors of 100+ Management Models.
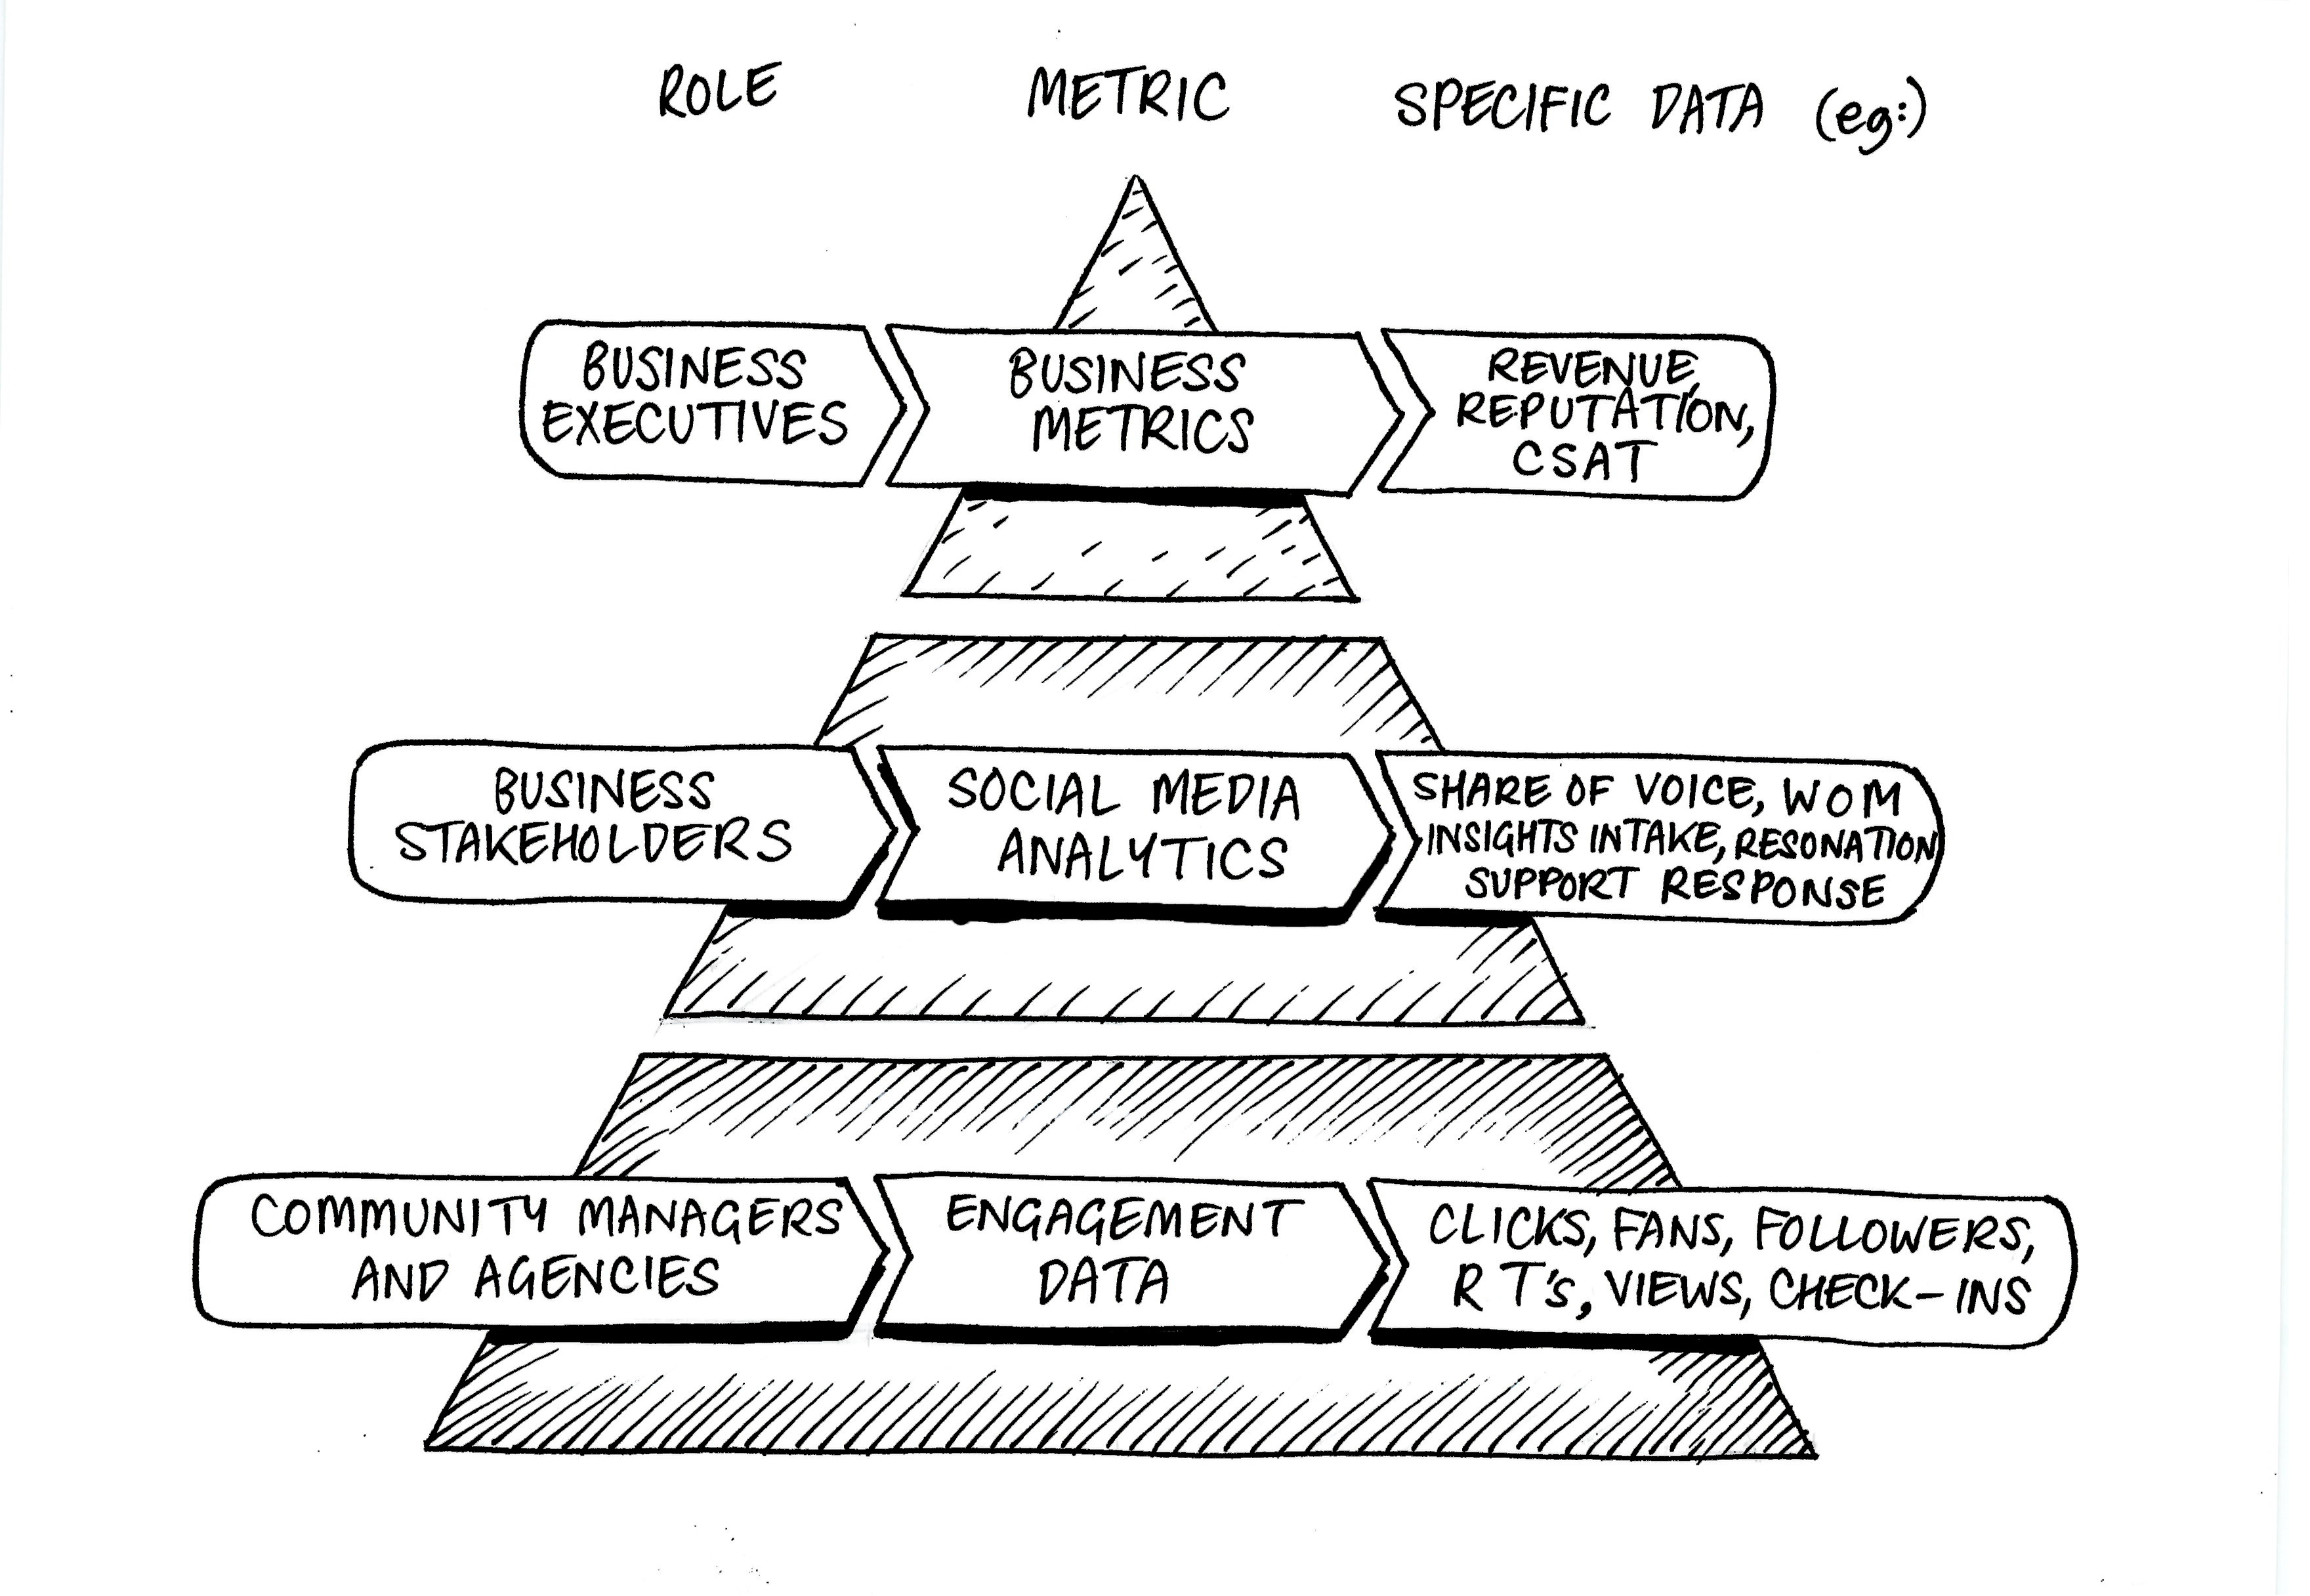
Problem statement
How can one measure the return on investment (ROI) of social media?
Essence
Return on investment (ROI) is a key concept in business, describing when an investment will be gained back. For investments in social media, Jeremiah Owyang, management consultant at Altimeter, developed a hierarchy of metrics, depicted above, to merge various forms of metrics for social media, serving various stakeholders in different roles. This model attempts to fulfil the need of an increasing number of organizations that find it difficult to define critical success factors and key performance indicators for online communications in general and social media in particular.
Owyang proposes distinguishing different, but related, metrics for different layers in an organization:
- Business metrics, for executives (and ‘everyone else who supports them’), summarizing the social media analytics;
- Social media analytics, for the managers and employees who are strongly engaged in social media, focusing on how social media impacts business;
- Engagement data, for community managers and communications agencies, measuring the social footprint in detail (e.g. in clicks, followers, likes, retweets, views, etc.).
How to use the model
Owyang proposes five steps to start using the ROI Pyramid:
- Start with a business goal in mind: expect significant challenges to occur if your social media efforts don’t have a business goal. It’s easy to spot when this happens, as the goal will be getting ‘more fans and followers’ rather than moving the business needle forward.
- Give the right data to the right roles: not all roles require the same types of data; be sure to give the right type of data to the right segment. While all the formulae of the pyramid should be accessible by the corporation, understand the viewpoints needed from each vantage point.
- Tailor the frequency and quantity of data along pyramid tiers: recognize that executives need reports less frequently than the deployment teams, hence their size on the pyramid. Also, there is more data needed at the bottom tiers than at the top; remember the top tiers are roll-up formulae from bottom tiers.
- Customize formulae: as long as there are no standards in measuring social media, there is no need to wait for them.
- Benchmark over time and cascade to all layers of the organization. Note that the specific numbers aren’t as important as the trend lines over time.
In addition, Owyang found that organizations apply ‘six ways of measuring the revenue impact of social media’, of which three are top-down: anecdotes, correlations and multivariate testing. The other three are bottom-up: measuring the ‘clicks’ (see also under ‘engagement data’ above), using integrated software and measuring e-commerce.
Results
Applying the model may result in developing an overall dashboard for the organization to monitor progress of a company’s conversation strategy, or it can be used to help define which metrics need further refinement and how they connect with other metrics (as, for instance, used in a balanced scorecard) that measure success in corporate communications.
Comments
Measuring the effect of communications has been a challenge for as long as communications have been studied. John Wanamaker, a pioneer of marketing in the nineteenth century, said: ‘Half the money I spend on advertising is wasted; the trouble is, I don’t know which half.’ Some critics argue that science hasn’t made much improvement since. Especially in online communications, trial and error is inevitable in making progress along the new frontiers of global communications. Measuring the plans and results will at least contribute to learning from mistakes and, at best, guide the organization into the envisioned future.
Literature
Blanchard, O. (2011) Social Media ROI: Managing and Measuring Social Media Efforts in your Organization, Boston, Pearson Education.
Broom, D., McCann, M., Bromby, M.C., Barlow, A. (2011) Return on Investment: What Literature Exists on the Use of Social Media and ROI? Available online at Social Science Research Network.
Kelly, N. (2013) How to Measure Social Media: A Step-by-Step Guide to Developing and Assessing Social Media ROI, Boston, Pearson Education.

Top 10 management models for your business #5: six stages of social business transformation
30 July 2014 by Infinite Ideas in 100+ Management Models, Business and finance
Fons Trompenaars and Piet Hein Coebergh, co-authors of 100+ Management Models.

Problem Statement
How can organizations optimize engagement with their target audience through social media?
Essence
Charlene Li and Brian Solis, consultants and authors on social media and digital marketing, have developed a leading body of knowledge on how organizations can deal with the rising importance of transparency and engagement. Their model builds on the ideas of Groundswell (Li and Bernoff, 2008), describing how people increasingly connect with each other to be informed, rather than listening to organizations. The book describes how companies are becoming less able to control customers’ attitudes through market research, customer service and advertising. Instead, customers increasingly control the conversation by using new media to communicate about products and companies. Li and Solis observe that organizations connect with customers by taking the following steps:
- Planning – ‘Listen and learn’: Ensure commitment to get the business social.
- Presence – ‘Stake our claim’: Evolution from planning to action, establishing a formal and informed presence in social media;
- Engagement – ‘Dialogue deepens relationships’: Commitment where social media is seen as a critical element in relationship-building;
- Formalized – ‘Organize for scale’: A formalized approach focuses on three key activities: establishing an executive sponsor, creating a centre of excellence and establishing organization-wide governance;
- Strategic – ‘Become a social business’: Social media initiatives gain visibility and real business impact.
- Converged – ‘Business to social’: Having cross-functional and executive support, social business strategies start to weave into the fabric of an evolving organization.
How to use the Model
The model can serve as a roadmap for organizations to improve their engagement with stakeholders, especially through social media. A model to measure current engagement of an organization with its target audience is Li’s Social Technographics Ladder (Li and Bernoff, 2008). The ladder identifies people according to how they use social technologies, classified as creators, critics, collectors, joiners, spectators and inactives. Taken together, these groups make up the ecosystem that forms the groundswell. Each step on the ladder represents a group of consumers more involved in the groundswell than the previous steps. To join the group on a step, a consumer need only participate in one of the listed activities. Steven van Belleghem, from Vlerick Business School, has developed a three-step approach to setting up and managing a conversation on any level of the Technographics Ladder: observe the conversation you perceive as relevant as an organization, facilitate the conversation you want to create and join the conversation as a peer.
Results
Implementing the model as a roadmap towards more social engagement requires leadership in managing this change process. The authors of Groundswell suggest the POST approach for change, working with people (assess social activities of customers), objectives (decide what you want to accomplish), strategy (plan for how relationships with customers will change) and technology (decide which social technologies to use).
Comments
The impact of the Internet on society in general, and of social media in particular, has not created a paradigm shift in social science, as yet. In academia, the information revolution and ongoing digitization is mostly being explained by classic models, of which the most powerful are included in this book. Competing with these classics is a burgeoning variety of authors and consultants who publish all sorts of new models, mainly through media where displaying academic evidence is considered of low importance. The books of Li and Solis may not represent the state of the art in academia, but they do offer research-based, new, practical and appealing approaches in defining digital marketing.
Literature
Duhé, S. ed. (2012) New Media and Public Relations, 2nd Ed., New York, Peter Lang
Publishing.
Li, C., Bernoff, J. (2011) Groundswell, expanded and revised edition: Winning in a World
Transformed by Social Technologies, Boston, Harvard Business School Press.
Solis, B. (2011) Engage! The Complete Guide for Brands and Businesses to Build, Cultivate, and
Measure Success in the New Web, Hoboken, John Wiley.
The Depopulation Time Bomb
28 July 2014 by Infinite Ideas in Business and finance, Codebreaking our future
by Michael Lee, author of Codebreaking our future
The future of nations is not written in the stars but in their demographics. In particular, a futurist can study national fertility rates, urbanisation trends and the age structure of population groups to get a picture of a country’s long-term future.
Remarkable polymath Benjamin Franklin was one of the founding fathers of America and, back in the 1770s, he enjoyed unbridled optimism about the future of his nation, which at the time was still overwhelmingly rural and comparatively “backward”. Why, then, was his prognosis so rosy? America’s birth-rate, he reasoned, was double that of Europe’s. Today, the position in America has been reversed and there are no grounds for any of Franklin’s demographic optimism. Between 1990-2002, the crude birth rate in the US declined by 17%. Similar declines are happening right across the developed and developing world. Before discussing this in more detail, let’s paint in broad brushstrokes the background for understanding the world’s current demographics.
The stand-out feature of a general picture of population trends is the astonishing discrepancy between underlying demographics and the current distribution of global power and wealth. It’s this disconnect which highlights the spaces in which the international order is going to shift in the coming decades. One can map international influence against population profiles to highlight this incongruity.
|
Region |
Total population (in millions) |
Annual rate of increase of population (%) 2010-2015 |
|
Asia (including Middle East) |
4,254,524 |
1.0 |
|
Africa |
1,083,524 |
2.5 |
|
Europe |
741,971 |
0.1 |
|
Latin America & the Caribbean |
609,807 |
1.1 |
|
North America |
352,471 |
0.8 |
|
Oceania (Australia, NZ, Polynesia, etc) |
37,775 |
1.4 |
|
World |
7,080,072 |
1.1 |
Table 1: World Population at 2012
(Sources: UN Demographic Yearbook 2012;
UN Population & Vital Statistics Report Series A, Vol. LXVI)
Observe in Table 1 that only Africa’s rate of population increase is significantly higher than the rather meagre global average of 1.1% per annum. Populations outside Africa and parts of Asia are just not increasing with any kind of vigour. You will also note that Africa and Asia (including the Middle East) together make up just over 75% of the world’s population at 5,338,048. By contrast, Europe makes up 10.5% of the world, Latin America & the Caribbean 9%, North America 5% and Oceania 0.5%. But something is interesting here. There is a complete mismatch between these population sizes and the distribution of global geo-political power today.
For example, if one estimates global economic and political influence by regions, it might well look something like this:
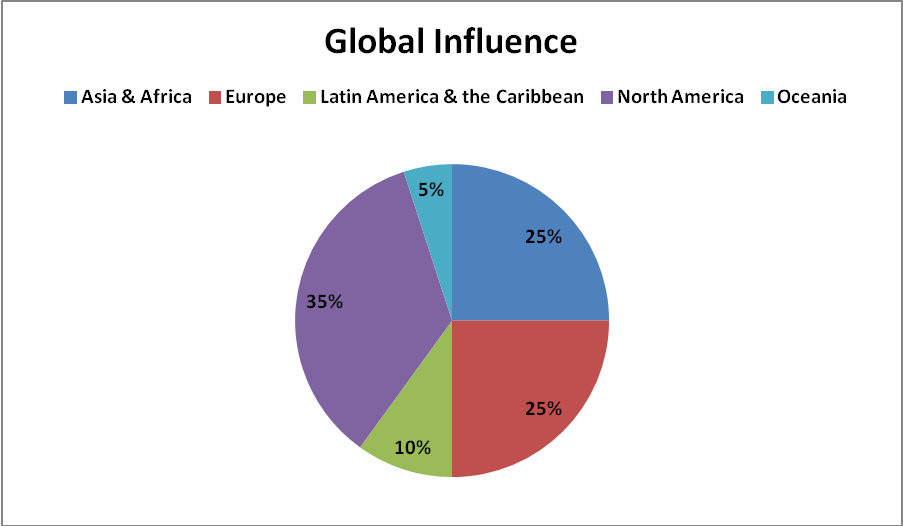
Figure 1: Estimated Global Influence by Region (Source: author)
In Figure 1, the dominant powers are North America and Europe, with 35% and 25% of global influence respectively. Next comes Africa and Asia together providing approximately 25% of the influence, Latin America & the Caribbean a further 10% and Oceania fighting above its demographic weight division at 5%.
Now, let’s turn to underlying population sizes for a completely different picture.
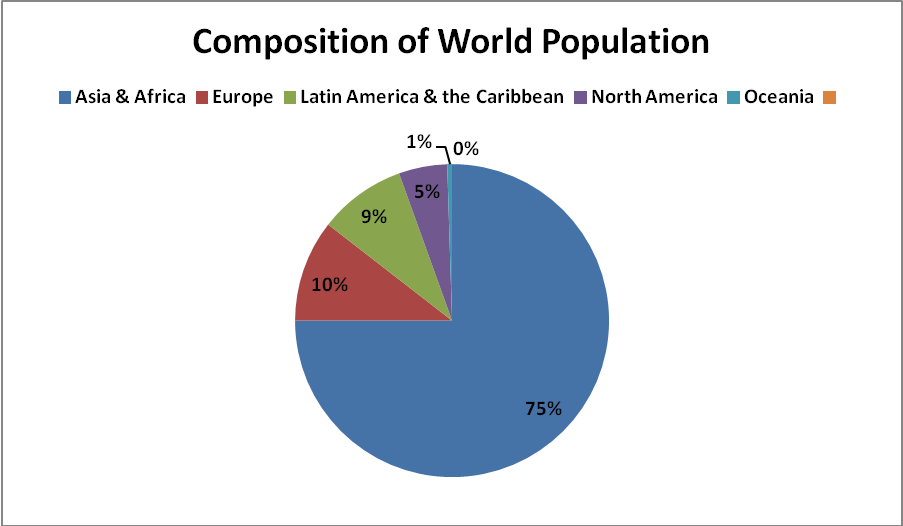
Figure 2: Composition of World Population by Region (Source: author)
North America, with 35% of the influence, has 5% of the global population. Europe, with 25% of the influence, has 10.5% of the population. Africa and Asia, with only 25% of the influence, have 75% of the population. Latin America & the Caribbean have 10% of the influence and 9% of the population. And Oceania has 5% of the influence but only 0.5% of the population. This skewed distribution of power is bound to change on a large scale throughout this century.
Population sizes indicate the potential magnitude of an economy and its markets, in the sense that its citizens are the producers, the consumers and the tax payers. Of course, urbanisation and development levels have to be factored in, too, as do resources. In addition, the age structure of the population, whether it is young and growing or ageing and declining, is a key consideration. Crudely, though, the following mapping of global influence over population size provides a context for speculation on future shifts of influence, highlighting from which regions they are most likely to come.
|
|
Relative Influence |
Relative Size |
Probable long-term shift in influence |
| Asia and Africa |
25% |
75% |
Greater |
| Europe |
25% |
10.5% |
Lower |
| Latin America & the Caribbean |
10% |
9% |
Equal to |
| North America |
35% |
5% |
Lower |
| Oceania |
5% |
0.5% |
Lower |
Table 2: Relative influence versus size to indicate potential shifts of influence (Source: author)
Table 2 is only a rough guide to potential future shifts of international influence based on the simple equation that size matters when it comes to economies, especially, as mentioned, when seen in the context of developmental factors and the age profile of the population in question. (You are welcome to play around with the figures for estimated global influence by region to come up with your own “map”). The differentials between influence and size in Table 2 are:
Africa & Asia = 50% +
Europe = -14.5%
Latin America & the Caribbean = -1%
North America = -30%
Oceania = -5.5%
These differentials show the conditions for extensive changes of power in the coming decades. It’s an X-ray of a future changing international order.
The population sizes for the countries in the BRICS trade bloc of developing economies, for example, are:
Brazil: 190.7 million
Russia: 143.4 million
India: 1.2 billion
China: 1.3 billion
South Africa: 51 million
If one takes the “CIA” regions of the world – China/India/Africa – the population sizes are:
China: 1.3 billion
India: 1.2 billion
Africa: 1 billion
= 3.5 billion (about 50% of world’s population)
The size of potential new and extended markets in these CIA regions is vast and there is likely going to be an increasing wealth base and growing influence across these regions.
I regard demographics as one of the most impressive of all the social sciences. This discipline largely deals with real, socially significant population data. Its figures are squarely based on facts. This allows for robust, evidence-based reasoning. With demographics, we’re looking into a radar of the future.
Which brings me to a disturbing reality I wish to share with you today. Like the inferences made from the data in Table 2, this fact may appear, at first glance, to be counter-intuitive. I referred earlier in looking at Table 1 to the meagre global rates of annual population increases this century. Birth-rates are falling all over the world in deeply entrenched trends rooted in the very nature of modern society. A human depopulation time bomb is ticking.
Human population growth is decreasing at a rate which will imperil the global economy, destabilise some societies and ultimately threaten humanity’s prospects for survival.
US demographer and senior fellow at the New America Foundation, Phillip Longman, explains: “World population growth has already slowed dramatically over the last generation and is headed on course for absolute decline. Indeed, forecasts by the United Nations and others show the world population growth rate could well turn negative during the lifetimes of people now in their 40sand 50s.”[1]
Longman is warning us that population growth for humanity is likely to turn negative around mid-century. This means the world’s total population size would start to decrease in absolute terms. If such a trend ever became irreversible, it would eventually lead to the extinction of the human race.
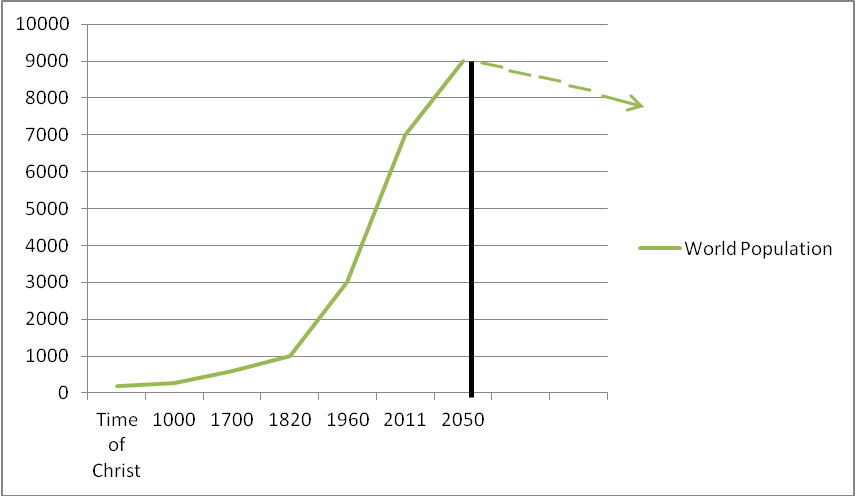
Figure 3: The rise of world population to its projected peak in 2050
Figure 3 indicates that the total human population may peak in 2050 at nine billion and thereafter decline year after year, decade after decade, generation after generation. It’s not a comforting thought that Population Peak for the human race is probably just up ahead of us.
Shrinking nations and families conjure up nightmarish scenarios of a declining world population. If sub-replacement fertility rates across the world continue compounding century after century, it’s a mathematical certainty that the human race will one day become extinct.
The core fact is that global fertility rates are half what they were in 1972. This is disconcerting given that fertility rates are what keep the human race reproducing itself. The fall in global fertility is the key global problem to address in this century.
The following data together brings home the extent of this trend, bearing in mind that the replacement fertility rate is 2.1 children per women and that, at the start of the 20th century, the global fertility rate was higher than five children per woman of child-bearing age:
- The world’s population growth rate has fallen from 2% p.a. in the late 1960s to just over 1% today, and is predicted to slow further to 0.7% by 2030 and then 0.4% by 2050.[2]
- 62 countries, making up almost half the world’s population, now have fertility rates at, or below, the replacement rate of 2.1, including most of the industrial world and Asian powers like China, Taiwan and South Korea.[3]
- Most European countries are on a path to population ageing and absolute population decline[4], in fact, no country in Europe is demographically replacing its population[5] – “If Europe’s current fertility rate of around 1.5 births per woman persists until 2020, this will result in 88 million fewer Europeans by the end of the century.”[6]
- Spain has the lowest fertility rates ever recorded
- Russia, and most of the Balkans and Eastern Europe, are facing a fall in the size of their populations of between 13-35 % in the next four decades, with China’s starting to fall between 2030- 2035 and Thailand’s after about 2040[7]
- Japan’s fertility rate is 1.4 children per women, one of the lowest
- China’s fertility rate is between 1.5 and 1.65
- Cuba has one of the lowest fertility rates in the world
- Italy, once the seat of the Roman Empire that ruled most of the known world, has a disastrously low fertility rate of 1.2
- Since 1975, Brazil’s fertility rate has dropped nearly in half to just 2.27 children per woman[8]
- By mid-century, China could lose 20-30% of its population every generation[9]
- By 2050, the median age of the world’s population will be 38 years, in Europe, 47, China, 45, in North America and Asia about 41[10]
It’s the scale of the depopulation problem that is daunting. Longman explains: “All told, some 59 countries, comprising roughly 44 percent of the world’s total population, are currently not producing enough children to avoid population decline, and the phenomenon continues to spread. By 2050, according to the latest United Nations projections, 75 percent of all countries, even in underdeveloped regions, will be reproducing at below-replacement levels.”[11] Consequently, he’s expecting the world population to peak around 2050.[12]
A silent demographic revolution is happening to our world.
Associated with human depopulation is the inevitable ageing of the global population. [13] This will have dramatic, long-term impacts on economies. Population trends drive changes across a range of fields from economics and finances to politics, from sociology to international relations. Ageing populations spend less and produce less, depressing business demand. Societies in Asia, Europe and the Americas are turning grey and there are concerns about the drain on public expenditure and the loss of national productivity which will ensue. Population ageing will place added burdens on both government finances and the working generation. This affects the economy directly: “There is a reasonably robust theory…that suggests people accumulate wealth between the ages of 30 and 60 for retirement, after which they tend to save less or ‘dis-save’.”[14]
Longman establishes a link between demography and economics early in his landmark book The Empty Cradle: “Capitalism has never flourished except when accompanied by population growth.”[15] Businesses, he says, go where populations are growing, not where they’re declining. Why? Because there’ll be more demand for their goods: “More people create more demand for the products capitalists sell, and more supply of the labor capitalists buy.”[16] Here’s the simple equation illustrating the loop between demographics and economics: “Because of today’s low birth-rates, there will be fewer workers available in the future to produce the goods and services consumed by each retiree.”[17]
And here’s the result for the economy: “The working population of the United States essentially will wind up paying one out of every five dollars it earns just to support retirees, while simultaneously trying to finance more and more years of higher education…”, creating financial disincentives for families to produce many children.[18]
A stagnant population, in other words, is likely to produce a stagnant economy. When there’s depopulation, investment and business confidence eventually vanish, along with economic growth: “Without population growth providing an ever increasing supply of workers and consumers, economic growth would depend entirely on pushing more people into the work force and getting more out of them each day.”[19]
In sum, then, there are significant declines in birth-rates right across the world, sometimes well below replacement levels. The depopulation time bomb isn’t science fiction, it’s a matter of demographic fact.
The populations of major nations like Japan and Russia are already shrinking in size at worrying rates.
Japan, once the 2nd largest economy in the world, is now into its third decade of sluggish growth due to its twin curses of declining population and productivity and population ageing. In desperation, it’s turning to robotics to inject new life into its zombie economy.
Similarly, Russia is facing its own depopulation bomb. It’s estimated to lose between 13-35% of its population size in the next four decades. In 1937, Russia had a population of 162 million. This has fallen to 142 million. It’s predicted to fall further to about 80-90 million by mid-century. Between 1937-2050, then, the country’s population size could have halved. At a time when it’s once again emerging as an energy giant, its demographics, ironically, are undermining its future prospects. The demographic challenge of halting depopulation will be complicated by the presence of an estimated 14.5 million Muslims in the country which may threaten unity and heighten ethnic tensions within its borders.
As a futurist, I have to admit my blood runs cold when I consider such overwhelming and conclusive evidence of humanity losing its appetite to reproduce itself.
Acknowledgments
Longman, P. 2004. The Empty Cradle. New York: Basic Books.
Magnus,G. 2009. The Age of Ageing. Singapore: John Wiley & Sons..
“Population and Vital Statistics Report, Series A Vol. LXVI”, Population Division of the United Nations Department of Economic and Social Affairs Department of Economic an d Social Affairs Statistics Division. See http://unstats.un.org/unsd/demographic/default.htm
UN Demographic yearbook 2012 (63rd Issue), New York: 2013.
[1] Longman, The Empty Cradle (2004)7.
[2] Magnus, The Age of Ageing (2009) 33.
[3] Magnus, The Age of Ageing (2009) 40.
[4] Longman, The Empty Cradle (2004) 61.
[5] Longman, The Empty Cradle (2004) 177.
[6] Longman, The Empty Cradle (2004) 67.
[7] Magnus, The Age of Ageing (2009) 158.
[8] Longman, The Empty Cradle (2004) 32.
[9] Longman, The Empty Cradle (2004) 11.
[10] Magnus, The Age of Ageing (2009) xxi-xxii.
[11] Longman, The Empty Cradle (2004) 26.
[12] Longman, The Empty Cradle (2004) 27.
[13] Longman, The Empty Cradle (2004) xiii.
[14] Magnus, The Age of Ageing (2009) 114.
[15] Longman, The Empty Cradle (2004) 4.
[16] Longman, The Empty Cradle (2004) 4.
[17] Longman, The Empty Cradle (2004) 19.
[18] Longman, The Empty Cradle (2004) 22.
[19] Longman, The Empty Cradle (2004) 5. Longman states: “A nation’s gross domestic product is literally the sum of its labour force times the average output per worker. Thus, a decline in the number of workers implies a decline in an economy’s growth potential…The European Commission…projects that Europe’s potential growth rate over the next fifty years will fall by 40 percent due to the shrinking size of the European work force.” Longman, The Empty Cradle (2004).41. He further elaborates as follows: “Exploding health and pension costs, along with a shrinking tax base, diminish resources available to households, government, and the private sector for investing in the next generation, even as the need for human capital formation increases. Another reason is rooted in the realities of the life cycle. It’s not just that most technological breakthroughs and entrepreneurial activity tend to come from people in their 20s and 30s…an ageing population will likely become increasingly risk averse….” Longman, The Empty Cradle (2004) 43.