The Depopulation Time Bomb
28 July 2014 by Infinite Ideas in Business and finance, Codebreaking our future
by Michael Lee, author of Codebreaking our future
The future of nations is not written in the stars but in their demographics. In particular, a futurist can study national fertility rates, urbanisation trends and the age structure of population groups to get a picture of a country’s long-term future.
Remarkable polymath Benjamin Franklin was one of the founding fathers of America and, back in the 1770s, he enjoyed unbridled optimism about the future of his nation, which at the time was still overwhelmingly rural and comparatively “backward”. Why, then, was his prognosis so rosy? America’s birth-rate, he reasoned, was double that of Europe’s. Today, the position in America has been reversed and there are no grounds for any of Franklin’s demographic optimism. Between 1990-2002, the crude birth rate in the US declined by 17%. Similar declines are happening right across the developed and developing world. Before discussing this in more detail, let’s paint in broad brushstrokes the background for understanding the world’s current demographics.
The stand-out feature of a general picture of population trends is the astonishing discrepancy between underlying demographics and the current distribution of global power and wealth. It’s this disconnect which highlights the spaces in which the international order is going to shift in the coming decades. One can map international influence against population profiles to highlight this incongruity.
|
Region |
Total population (in millions) |
Annual rate of increase of population (%) 2010-2015 |
|
Asia (including Middle East) |
4,254,524 |
1.0 |
|
Africa |
1,083,524 |
2.5 |
|
Europe |
741,971 |
0.1 |
|
Latin America & the Caribbean |
609,807 |
1.1 |
|
North America |
352,471 |
0.8 |
|
Oceania (Australia, NZ, Polynesia, etc) |
37,775 |
1.4 |
|
World |
7,080,072 |
1.1 |
Table 1: World Population at 2012
(Sources: UN Demographic Yearbook 2012;
UN Population & Vital Statistics Report Series A, Vol. LXVI)
Observe in Table 1 that only Africa’s rate of population increase is significantly higher than the rather meagre global average of 1.1% per annum. Populations outside Africa and parts of Asia are just not increasing with any kind of vigour. You will also note that Africa and Asia (including the Middle East) together make up just over 75% of the world’s population at 5,338,048. By contrast, Europe makes up 10.5% of the world, Latin America & the Caribbean 9%, North America 5% and Oceania 0.5%. But something is interesting here. There is a complete mismatch between these population sizes and the distribution of global geo-political power today.
For example, if one estimates global economic and political influence by regions, it might well look something like this:
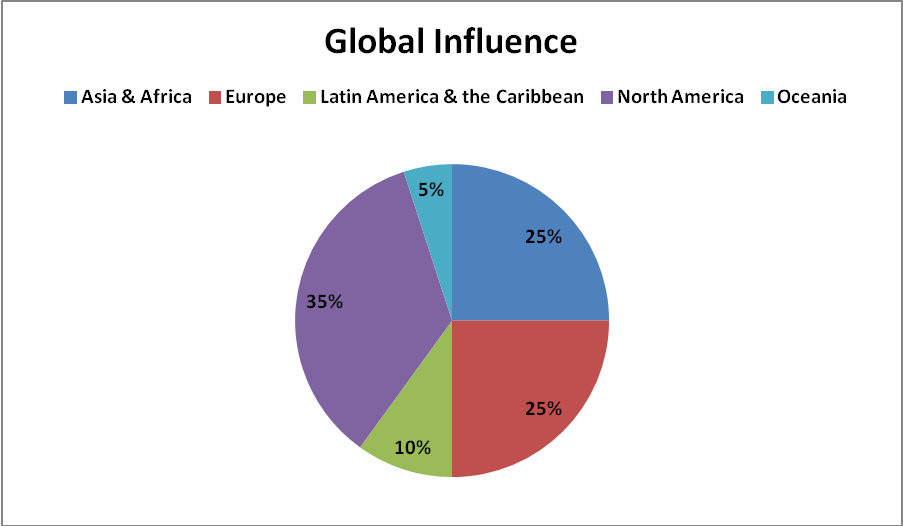
Figure 1: Estimated Global Influence by Region (Source: author)
In Figure 1, the dominant powers are North America and Europe, with 35% and 25% of global influence respectively. Next comes Africa and Asia together providing approximately 25% of the influence, Latin America & the Caribbean a further 10% and Oceania fighting above its demographic weight division at 5%.
Now, let’s turn to underlying population sizes for a completely different picture.
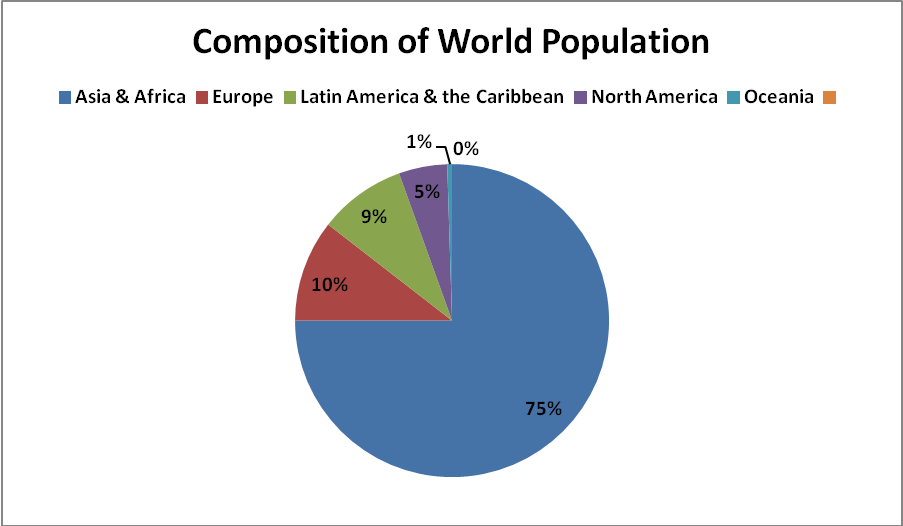
Figure 2: Composition of World Population by Region (Source: author)
North America, with 35% of the influence, has 5% of the global population. Europe, with 25% of the influence, has 10.5% of the population. Africa and Asia, with only 25% of the influence, have 75% of the population. Latin America & the Caribbean have 10% of the influence and 9% of the population. And Oceania has 5% of the influence but only 0.5% of the population. This skewed distribution of power is bound to change on a large scale throughout this century.
Population sizes indicate the potential magnitude of an economy and its markets, in the sense that its citizens are the producers, the consumers and the tax payers. Of course, urbanisation and development levels have to be factored in, too, as do resources. In addition, the age structure of the population, whether it is young and growing or ageing and declining, is a key consideration. Crudely, though, the following mapping of global influence over population size provides a context for speculation on future shifts of influence, highlighting from which regions they are most likely to come.
|
|
Relative Influence |
Relative Size |
Probable long-term shift in influence |
| Asia and Africa |
25% |
75% |
Greater |
| Europe |
25% |
10.5% |
Lower |
| Latin America & the Caribbean |
10% |
9% |
Equal to |
| North America |
35% |
5% |
Lower |
| Oceania |
5% |
0.5% |
Lower |
Table 2: Relative influence versus size to indicate potential shifts of influence (Source: author)
Table 2 is only a rough guide to potential future shifts of international influence based on the simple equation that size matters when it comes to economies, especially, as mentioned, when seen in the context of developmental factors and the age profile of the population in question. (You are welcome to play around with the figures for estimated global influence by region to come up with your own “map”). The differentials between influence and size in Table 2 are:
Africa & Asia = 50% +
Europe = -14.5%
Latin America & the Caribbean = -1%
North America = -30%
Oceania = -5.5%
These differentials show the conditions for extensive changes of power in the coming decades. It’s an X-ray of a future changing international order.
The population sizes for the countries in the BRICS trade bloc of developing economies, for example, are:
Brazil: 190.7 million
Russia: 143.4 million
India: 1.2 billion
China: 1.3 billion
South Africa: 51 million
If one takes the “CIA” regions of the world – China/India/Africa – the population sizes are:
China: 1.3 billion
India: 1.2 billion
Africa: 1 billion
= 3.5 billion (about 50% of world’s population)
The size of potential new and extended markets in these CIA regions is vast and there is likely going to be an increasing wealth base and growing influence across these regions.
I regard demographics as one of the most impressive of all the social sciences. This discipline largely deals with real, socially significant population data. Its figures are squarely based on facts. This allows for robust, evidence-based reasoning. With demographics, we’re looking into a radar of the future.
Which brings me to a disturbing reality I wish to share with you today. Like the inferences made from the data in Table 2, this fact may appear, at first glance, to be counter-intuitive. I referred earlier in looking at Table 1 to the meagre global rates of annual population increases this century. Birth-rates are falling all over the world in deeply entrenched trends rooted in the very nature of modern society. A human depopulation time bomb is ticking.
Human population growth is decreasing at a rate which will imperil the global economy, destabilise some societies and ultimately threaten humanity’s prospects for survival.
US demographer and senior fellow at the New America Foundation, Phillip Longman, explains: “World population growth has already slowed dramatically over the last generation and is headed on course for absolute decline. Indeed, forecasts by the United Nations and others show the world population growth rate could well turn negative during the lifetimes of people now in their 40sand 50s.”[1]
Longman is warning us that population growth for humanity is likely to turn negative around mid-century. This means the world’s total population size would start to decrease in absolute terms. If such a trend ever became irreversible, it would eventually lead to the extinction of the human race.
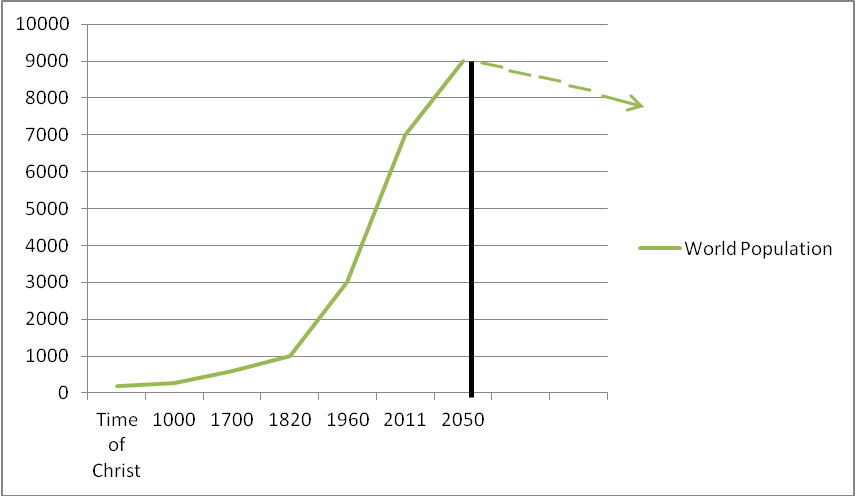
Figure 3: The rise of world population to its projected peak in 2050
Figure 3 indicates that the total human population may peak in 2050 at nine billion and thereafter decline year after year, decade after decade, generation after generation. It’s not a comforting thought that Population Peak for the human race is probably just up ahead of us.
Shrinking nations and families conjure up nightmarish scenarios of a declining world population. If sub-replacement fertility rates across the world continue compounding century after century, it’s a mathematical certainty that the human race will one day become extinct.
The core fact is that global fertility rates are half what they were in 1972. This is disconcerting given that fertility rates are what keep the human race reproducing itself. The fall in global fertility is the key global problem to address in this century.
The following data together brings home the extent of this trend, bearing in mind that the replacement fertility rate is 2.1 children per women and that, at the start of the 20th century, the global fertility rate was higher than five children per woman of child-bearing age:
- The world’s population growth rate has fallen from 2% p.a. in the late 1960s to just over 1% today, and is predicted to slow further to 0.7% by 2030 and then 0.4% by 2050.[2]
- 62 countries, making up almost half the world’s population, now have fertility rates at, or below, the replacement rate of 2.1, including most of the industrial world and Asian powers like China, Taiwan and South Korea.[3]
- Most European countries are on a path to population ageing and absolute population decline[4], in fact, no country in Europe is demographically replacing its population[5] – “If Europe’s current fertility rate of around 1.5 births per woman persists until 2020, this will result in 88 million fewer Europeans by the end of the century.”[6]
- Spain has the lowest fertility rates ever recorded
- Russia, and most of the Balkans and Eastern Europe, are facing a fall in the size of their populations of between 13-35 % in the next four decades, with China’s starting to fall between 2030- 2035 and Thailand’s after about 2040[7]
- Japan’s fertility rate is 1.4 children per women, one of the lowest
- China’s fertility rate is between 1.5 and 1.65
- Cuba has one of the lowest fertility rates in the world
- Italy, once the seat of the Roman Empire that ruled most of the known world, has a disastrously low fertility rate of 1.2
- Since 1975, Brazil’s fertility rate has dropped nearly in half to just 2.27 children per woman[8]
- By mid-century, China could lose 20-30% of its population every generation[9]
- By 2050, the median age of the world’s population will be 38 years, in Europe, 47, China, 45, in North America and Asia about 41[10]
It’s the scale of the depopulation problem that is daunting. Longman explains: “All told, some 59 countries, comprising roughly 44 percent of the world’s total population, are currently not producing enough children to avoid population decline, and the phenomenon continues to spread. By 2050, according to the latest United Nations projections, 75 percent of all countries, even in underdeveloped regions, will be reproducing at below-replacement levels.”[11] Consequently, he’s expecting the world population to peak around 2050.[12]
A silent demographic revolution is happening to our world.
Associated with human depopulation is the inevitable ageing of the global population. [13] This will have dramatic, long-term impacts on economies. Population trends drive changes across a range of fields from economics and finances to politics, from sociology to international relations. Ageing populations spend less and produce less, depressing business demand. Societies in Asia, Europe and the Americas are turning grey and there are concerns about the drain on public expenditure and the loss of national productivity which will ensue. Population ageing will place added burdens on both government finances and the working generation. This affects the economy directly: “There is a reasonably robust theory…that suggests people accumulate wealth between the ages of 30 and 60 for retirement, after which they tend to save less or ‘dis-save’.”[14]
Longman establishes a link between demography and economics early in his landmark book The Empty Cradle: “Capitalism has never flourished except when accompanied by population growth.”[15] Businesses, he says, go where populations are growing, not where they’re declining. Why? Because there’ll be more demand for their goods: “More people create more demand for the products capitalists sell, and more supply of the labor capitalists buy.”[16] Here’s the simple equation illustrating the loop between demographics and economics: “Because of today’s low birth-rates, there will be fewer workers available in the future to produce the goods and services consumed by each retiree.”[17]
And here’s the result for the economy: “The working population of the United States essentially will wind up paying one out of every five dollars it earns just to support retirees, while simultaneously trying to finance more and more years of higher education…”, creating financial disincentives for families to produce many children.[18]
A stagnant population, in other words, is likely to produce a stagnant economy. When there’s depopulation, investment and business confidence eventually vanish, along with economic growth: “Without population growth providing an ever increasing supply of workers and consumers, economic growth would depend entirely on pushing more people into the work force and getting more out of them each day.”[19]
In sum, then, there are significant declines in birth-rates right across the world, sometimes well below replacement levels. The depopulation time bomb isn’t science fiction, it’s a matter of demographic fact.
The populations of major nations like Japan and Russia are already shrinking in size at worrying rates.
Japan, once the 2nd largest economy in the world, is now into its third decade of sluggish growth due to its twin curses of declining population and productivity and population ageing. In desperation, it’s turning to robotics to inject new life into its zombie economy.
Similarly, Russia is facing its own depopulation bomb. It’s estimated to lose between 13-35% of its population size in the next four decades. In 1937, Russia had a population of 162 million. This has fallen to 142 million. It’s predicted to fall further to about 80-90 million by mid-century. Between 1937-2050, then, the country’s population size could have halved. At a time when it’s once again emerging as an energy giant, its demographics, ironically, are undermining its future prospects. The demographic challenge of halting depopulation will be complicated by the presence of an estimated 14.5 million Muslims in the country which may threaten unity and heighten ethnic tensions within its borders.
As a futurist, I have to admit my blood runs cold when I consider such overwhelming and conclusive evidence of humanity losing its appetite to reproduce itself.
Acknowledgments
Longman, P. 2004. The Empty Cradle. New York: Basic Books.
Magnus,G. 2009. The Age of Ageing. Singapore: John Wiley & Sons..
“Population and Vital Statistics Report, Series A Vol. LXVI”, Population Division of the United Nations Department of Economic and Social Affairs Department of Economic an d Social Affairs Statistics Division. See http://unstats.un.org/unsd/demographic/default.htm
UN Demographic yearbook 2012 (63rd Issue), New York: 2013.
[1] Longman, The Empty Cradle (2004)7.
[2] Magnus, The Age of Ageing (2009) 33.
[3] Magnus, The Age of Ageing (2009) 40.
[4] Longman, The Empty Cradle (2004) 61.
[5] Longman, The Empty Cradle (2004) 177.
[6] Longman, The Empty Cradle (2004) 67.
[7] Magnus, The Age of Ageing (2009) 158.
[8] Longman, The Empty Cradle (2004) 32.
[9] Longman, The Empty Cradle (2004) 11.
[10] Magnus, The Age of Ageing (2009) xxi-xxii.
[11] Longman, The Empty Cradle (2004) 26.
[12] Longman, The Empty Cradle (2004) 27.
[13] Longman, The Empty Cradle (2004) xiii.
[14] Magnus, The Age of Ageing (2009) 114.
[15] Longman, The Empty Cradle (2004) 4.
[16] Longman, The Empty Cradle (2004) 4.
[17] Longman, The Empty Cradle (2004) 19.
[18] Longman, The Empty Cradle (2004) 22.
[19] Longman, The Empty Cradle (2004) 5. Longman states: “A nation’s gross domestic product is literally the sum of its labour force times the average output per worker. Thus, a decline in the number of workers implies a decline in an economy’s growth potential…The European Commission…projects that Europe’s potential growth rate over the next fifty years will fall by 40 percent due to the shrinking size of the European work force.” Longman, The Empty Cradle (2004).41. He further elaborates as follows: “Exploding health and pension costs, along with a shrinking tax base, diminish resources available to households, government, and the private sector for investing in the next generation, even as the need for human capital formation increases. Another reason is rooted in the realities of the life cycle. It’s not just that most technological breakthroughs and entrepreneurial activity tend to come from people in their 20s and 30s…an ageing population will likely become increasingly risk averse….” Longman, The Empty Cradle (2004) 43.